The bitcoin bear market has continued on recently as the crypto has failed to keep up any upwards momentum. How low can the price go before a bottom is in?
Bitcoin Price Models Put Different Targets For The Cycle Bottom
A recent post by CryptoQuant has discussed about the various pricing models for BTC and where they may suggest a potential bottom to be.
Before looking at the data of these price models, it’s best to first get a grasp of the major Bitcoin capitalization models.
The normal market cap of the crypto is calculated by taking the sum of the entire circulating supply and multiplying it by the current BTC price.
Another capitalization method is the “realized cap.” Where this model differs from the usual market cap is that instead of taking the latest value of BTC, it weights each coin in the circulation against the price at which that particular coin last moved, and then takes a sum for the whole supply.
Next is the “average cap,” which simply gives us the mean market cap for the entire life of Bitcoin by summing the market cap for each trading day and dividing by the total age of the crypto (in days).
Each of these capitalization models can be divided by the total number of coins in the circulating supply to give their own “price” (which, in the case of the market cap, will of course naturally be the normal current price).
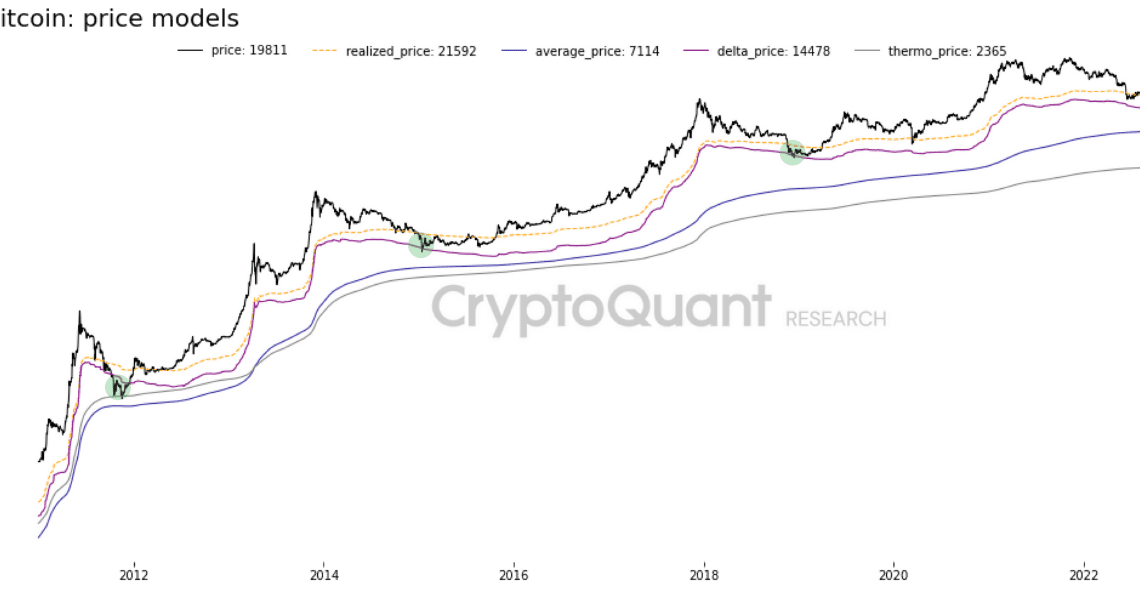
Now, here is a chart that shows the trend in these Bitcoin prices derived from these cap models:
Looks like the price has dipped below realized price | Source: CryptoQuant
Historically, the bear market bottoms for Bitcoin have usually formed whenever the price has traded below the realized price. Currently, the value of the crypto is satisfying this condition.
However, the realized price alone can’t pinpoint the bottoms, and this is precisely where the other models come in.
As you can see in the chart, two other prices, the “delta price” and the “thermo price” are also there. The former of these is derived through the “delta cap,” which is defined as the difference between the realized cap and the average cap.
In the 2015 and 2018 bears, the bottom was reached when Bitcoin declined to the delta price. Since this metric has a value of about $14.5k right now, it means the crypto could potentially go down another 28% from here before the bottom, if the past trend follows this time as well.
As for the thermo price, this model is similar to the realized price, except that instead of weighting…
Click Here to Read the Full Original Article at NewsBTC…


