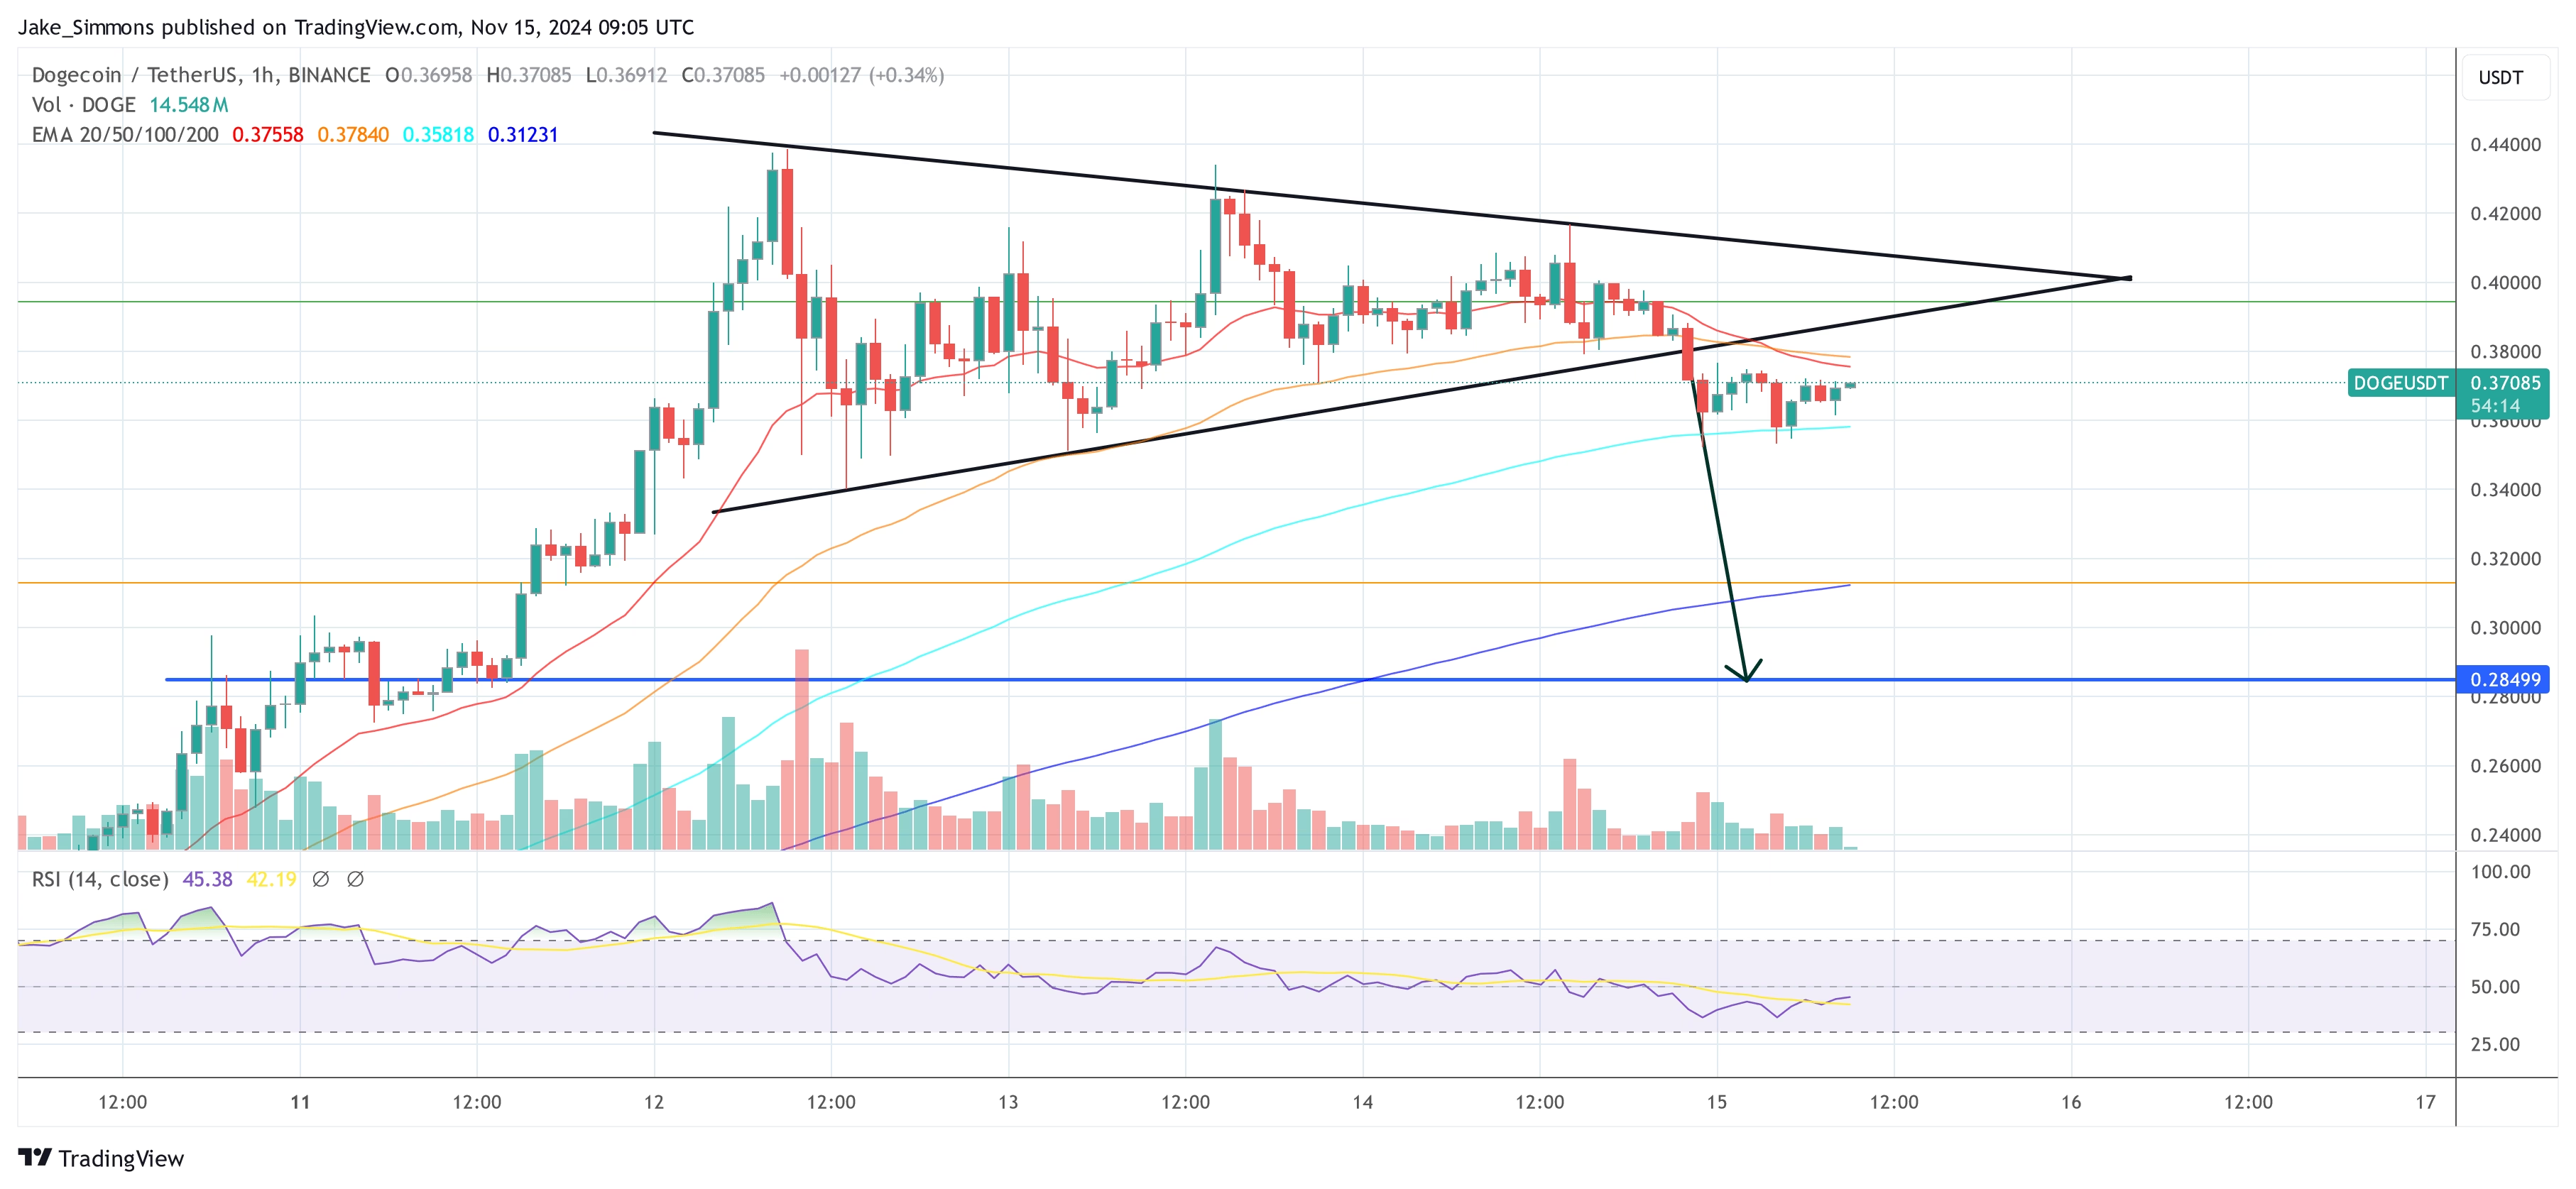
Dogecoin (DOGE) has recently experienced a staggering rally. Over the span of eight days, DOGE surged nearly 200%, reaching a local peak at $0.4385 on Tuesday. This explosive growth propelled the daily Relative Strength Index (RSI) to almost 93, signaling strongly overbought conditions.
Since then, the Dogecoin price corrected by 19%, trading at $0.37 as of press time. However, according to crypto analyst Kevin (@Kev_Capital_TA), who has gained significant attention on X for his Dogecoin price analyses, the correction phase may not be over yet. In a series of updates, Kevin addresses how low Dogecoin can go before resuming its upward trajectory.
How Low Can Dogecoin Go?
“My first price target and a level we will want to hold for Dogecoin is the $0.30-0.26 range, which is the golden pocket retrace levels,” Kevin stated. “That’s a 30-40% correction from the local top, which in a bull market is a perfect size correction.”
Related Reading
Kevin further explained the significance of RSI levels in predicting market movements. “A healthy 1-3 week correction/consolidation to cool off indicators would be the most beneficial thing that can happen to Dogecoin. Happened multiple times on the way up in 2020-2021,” he noted. “My opinion still remains this occurs soon based off the technical data I am looking at.”
Drawing parallels to the previous bull market, he added: “Back in the 2020-2021 bull market for Dogecoin, it hit a 90+ on daily RSI three times, each time marking a local top or consolidation period before the next leg up. We just hit 90+ on the daily RSI for the first time, signaling that we potentially have 1-2 more legs up remaining in this bull market before we find the macro top. PS: The second and third legs were both bigger than the first leg.”
On the lower time frames, the Dogecoin price action formed a symmetrical triangle, a chart pattern often associated with periods of consolidation that precede significant price movements. Kevin observed: “Tracking this weird Dogecoin symmetrical triangle. Honestly a 50/50 which way this breaks. I still favor the correction due to daily RSI being 90+.”
The symmetrical triangle can serve as either a continuation or a reversal pattern, depending on market conditions. For the Dogecoin price, the breakdown from the triangle…
Click Here to Read the Full Original Article at NewsBTC…


