
BNB has faced a significant rejection at a critical resistance level, raising concerns among traders about a potential price correction. After an impressive rally, the momentum has faltered, leaving the cryptocurrency at a crossroads.
This key level has proven to be a formidable barrier, indicating that selling pressure may be increasing as bears step in. However, the big question is whether this rejection marks the beginning of a downward correction or if the bulls can muster enough strength to regain their footing and continue pushing higher.
As the market navigates this pivotal moment, this piece will analyze BNB’s recent rejection at the critical resistance level and assess the implications for its price trajectory. By examining market trends, technical indicators, and trading volumes, this analysis will explore the possibility of a correction and what it could mean for traders.
Indicators Pointing Toward A Downside Correction For BNB
Recently, BNB’s price has turned bearish on the 4-hour chart, pulling back toward the 100-day Simple Moving Average (SMA) after facing rejection at the $605 resistance level. This downward move signals a shift in market sentiment as bulls struggle to maintain upward momentum. The rejection at the $605 resistance level has triggered heightened selling pressure that could push the price lower for a potential correction.
An analysis of the 4-hour Relative Strength Index (RSI) reveals that the signal line has dropped to 57%, retreating from its previous position in overbought territory. Typically, this decline indicates that the bullish momentum is weakening after reaching a peak, as buyers are beginning to lose steam.
Related Reading
Furthermore, on the daily chart, BNB is exhibiting negative momentum, as evidenced by the formation of a bearish candlestick, despite trading above the 100-day SMA. This situation reveals a possible contradiction in market sentiment. Meanwhile, if selling pressure continues and BNB is unable to maintain its position above the 100-day SMA, it may lead to a more significant price drop.
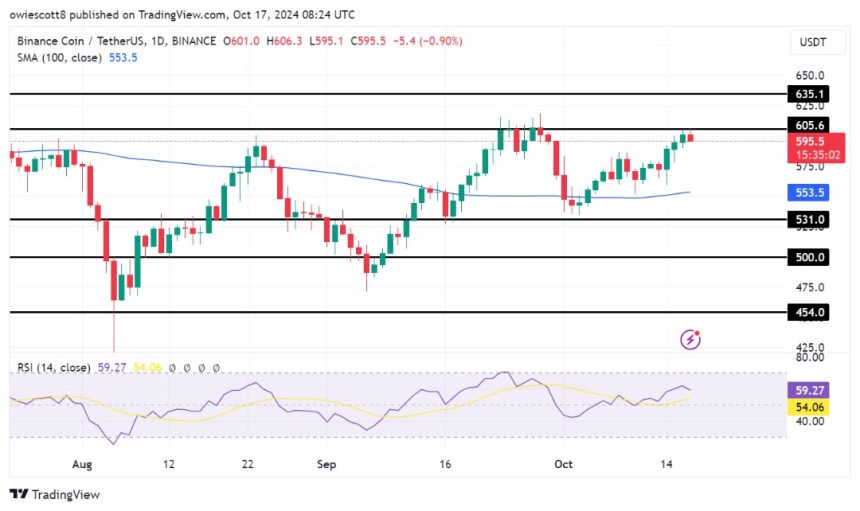
Finally, on the 1-day chart, the RSI has experienced a decline to 69% after rising to 62%, reflecting strong optimistic sentiment and buying pressure. Although the RSI…
Click Here to Read the Full Original Article at NewsBTC…


