Bitcoin (BTC) has made a bold move, breaking past the crucial $65,000 level and sparking renewed hope of reaching its all-time high. As bullish momentum builds, the market is watching closely to see if this breakthrough could be the start of a larger rally. With previous resistance now behind it, can Bitcoin continue its upward journey and reclaim its record peak? Or will market forces pull it back before reaching new heights?
The aim of this article is to explore BTC’s impressive move past the $65,000 level and evaluate its prospects of hitting a new peak. This piece will offer a comprehensive outlook on whether BTC can sustain its rally or face resistance as it approaches record territory through a detailed look at current market dynamics, rising power, and potential challenges.
What Breaking The $65,000 Barrier Means For Bitcoin
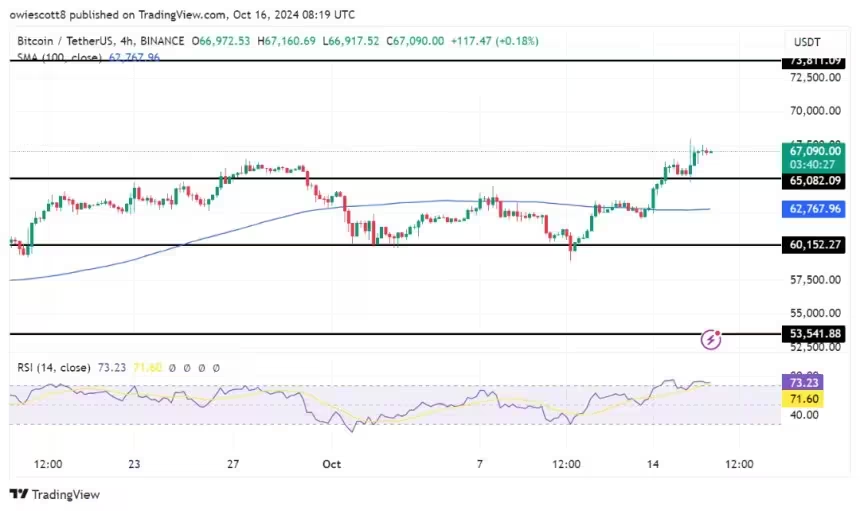
Currently, on the 4-hour chart, Bitcoin is sustaining its position after successfully surpassing the $65,000 mark while trading above the 100-day Simple Moving Average (SMA). By maintaining its position above the $65,000 mark and the 100-day SMA, BTC demonstrates resilience and potential for further upward momentum toward its all-time high of $73,811.
An analysis of the 4-hour Relative Strength Index (RSI) shows a significant surge, climbing to 77% after dropping to 50%, indicating strong bullish pressure for Bitcoin. While this increase signals growing positive market sentiment, it also raises concerns about the sustainability of the rally, as a possible price correction could occur if profit-taking ensues.
Related Reading
Furthermore, the daily chart indicates that Bitcoin is trading above the 100-day SMA, which is a strong signal of upbeat momentum. This upward movement is marked by a rebound at the $65,000 level, demonstrating significant buying interest from investors. The fact that BTC is consistently above the 100-day SMA suggests a solid trend and that the bulls are eager to push prices higher, potentially leading to more upside movement if pressure continues to build.
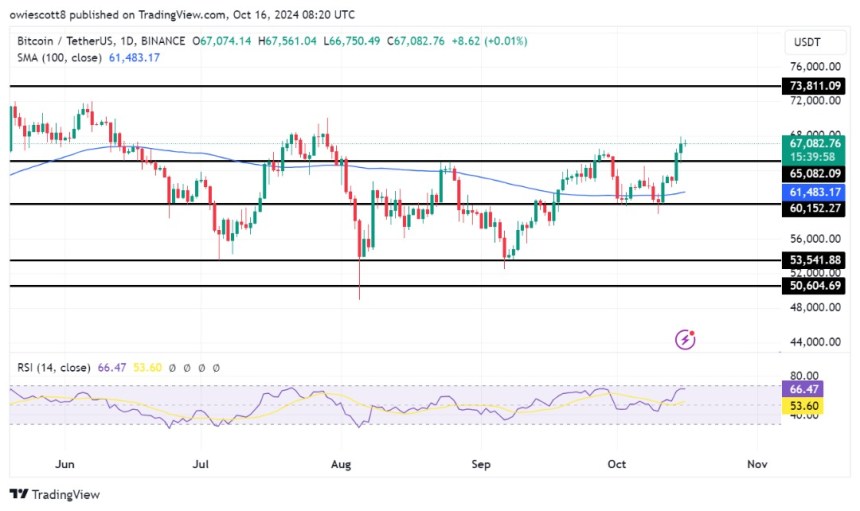
Lastly, the RSI on the daily chart is currently positioned at 66%, significantly above the pivotal 50% threshold, which indicates a bullish trend for…
Click Here to Read the Full Original Article at NewsBTC…


