Crypto analyst Egrag has provided an historical analysis of the weekly XRP price chart, suggesting that the cryptocurrency is entering “uncharted territory.” Utilizing historical data and focusing on critical technical indicators.
Egrag highlights significant shifts in XRP’s trading behavior, emphasizing the exhaustion felt by the XRP community during this prolonged cycle. “This cycle has been extremely exhausting and super manipulative, especially when it comes to XRP. But don’t lose hope!” he states.
Why XRP Is In Uncharted Territory
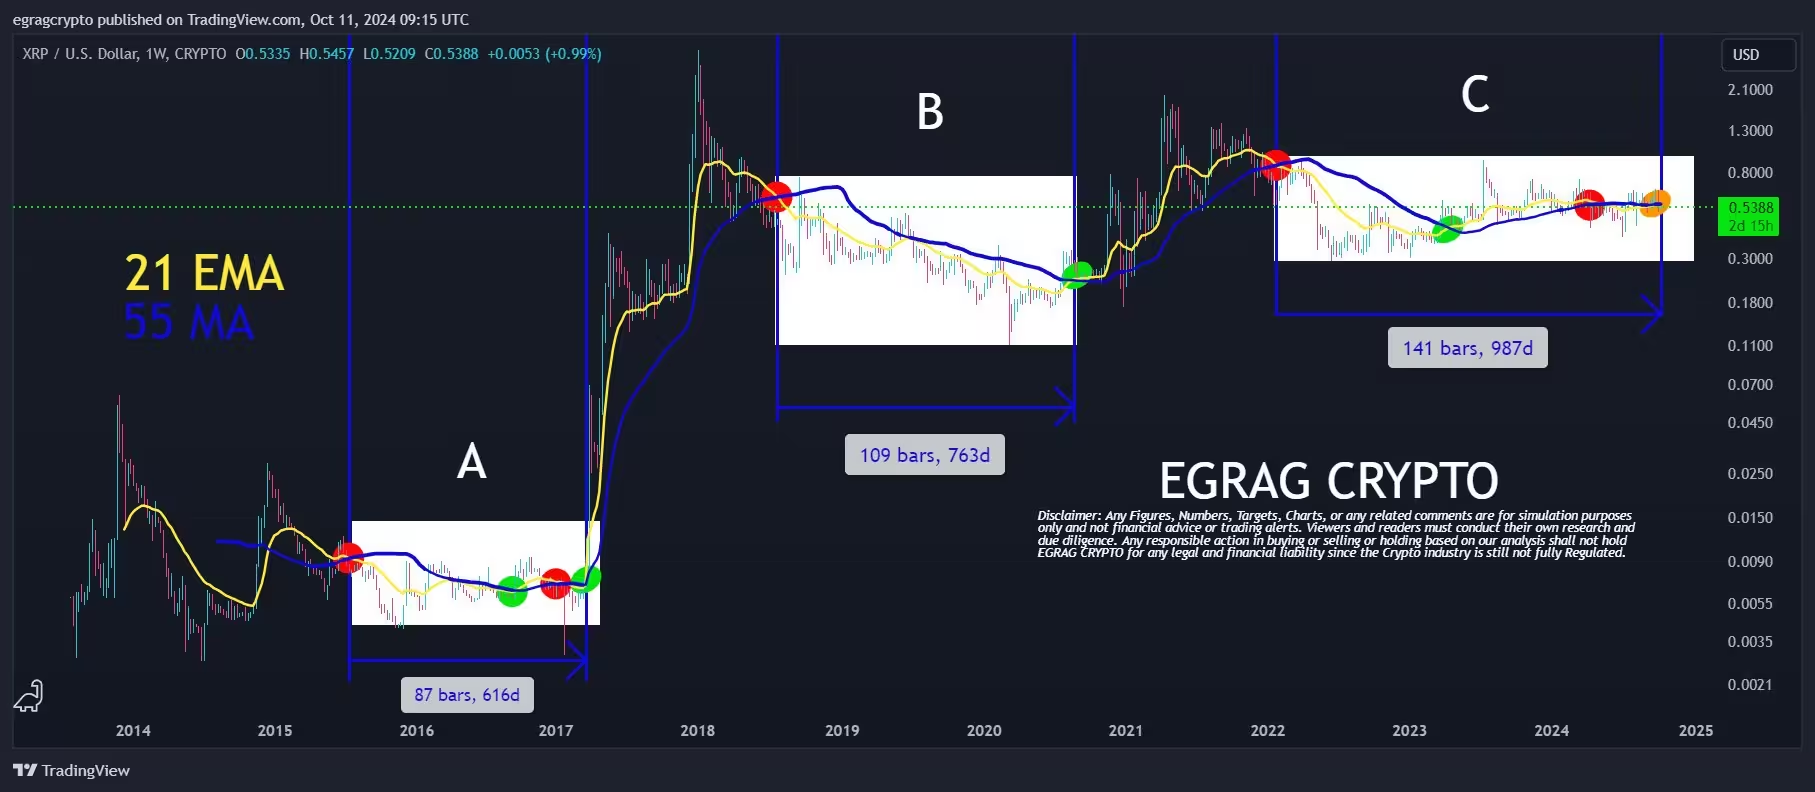
Central to Egrag’s analysis are two key indicators plotted on a weekly scale: the 21-week Exponential Moving Average (EMA) and the 55-week Simple Moving Average (MA). Both indicators are renowned for their responsiveness to price changes and have historically been indicative of market momentum shifts for XRP. The interactions between these moving averages, particularly when they cross, are pivotal in forecasting potential bullish or bearish trends.
Related Reading
Egrag identifies three types of crosses in his analysis, each signaling different market sentiments. A bearish cross, marked by a red circle on his chart, occurs when the 21-week EMA crosses below the 55-week MA, indicating potential downward momentum. A bullish cross, denoted by a green circle, happens when the 21-week EMA crosses above the 55-week MA, signaling possible upward movement. An indecisive cross, represented by an orange circle, marks periods where the moving averages converge but do not decisively cross, reflecting uncertainty or possible market manipulation.
In Cycle A, XRP experienced a bearish cross followed by two bullish crosses, with significant implications for its price trajectory. The period from the bearish cross to the first bullish cross spanned approximately 616 days, during which the market sentiment gradually shifted. Midway through this cycle, there was another bearish cross about 140 days after the first bullish cross, preceding the second bullish cross that occurred 49 days later. This second bullish cross led to an explosive price movement. Egrag remarks, “We had a bearish cross, followed by two bullish crosses—one midway through the cycle and the second was explosive!
Related Reading
Cycle B presented a different scenario, featuring one bearish cross followed by…
Click Here to Read the Full Original Article at NewsBTC…


