In an analysis shared via X and YouTube, crypto analyst Matt “The Great Mattsby” Hughes highlighted what could be a historic move for the XRP price, based on the Bollinger Bands indicator. Hughes points to an impending squeeze in XRP’s monthly Bollinger Bands, suggesting a potential spike similar to previous rallies where the cryptocurrency saw massive gains.
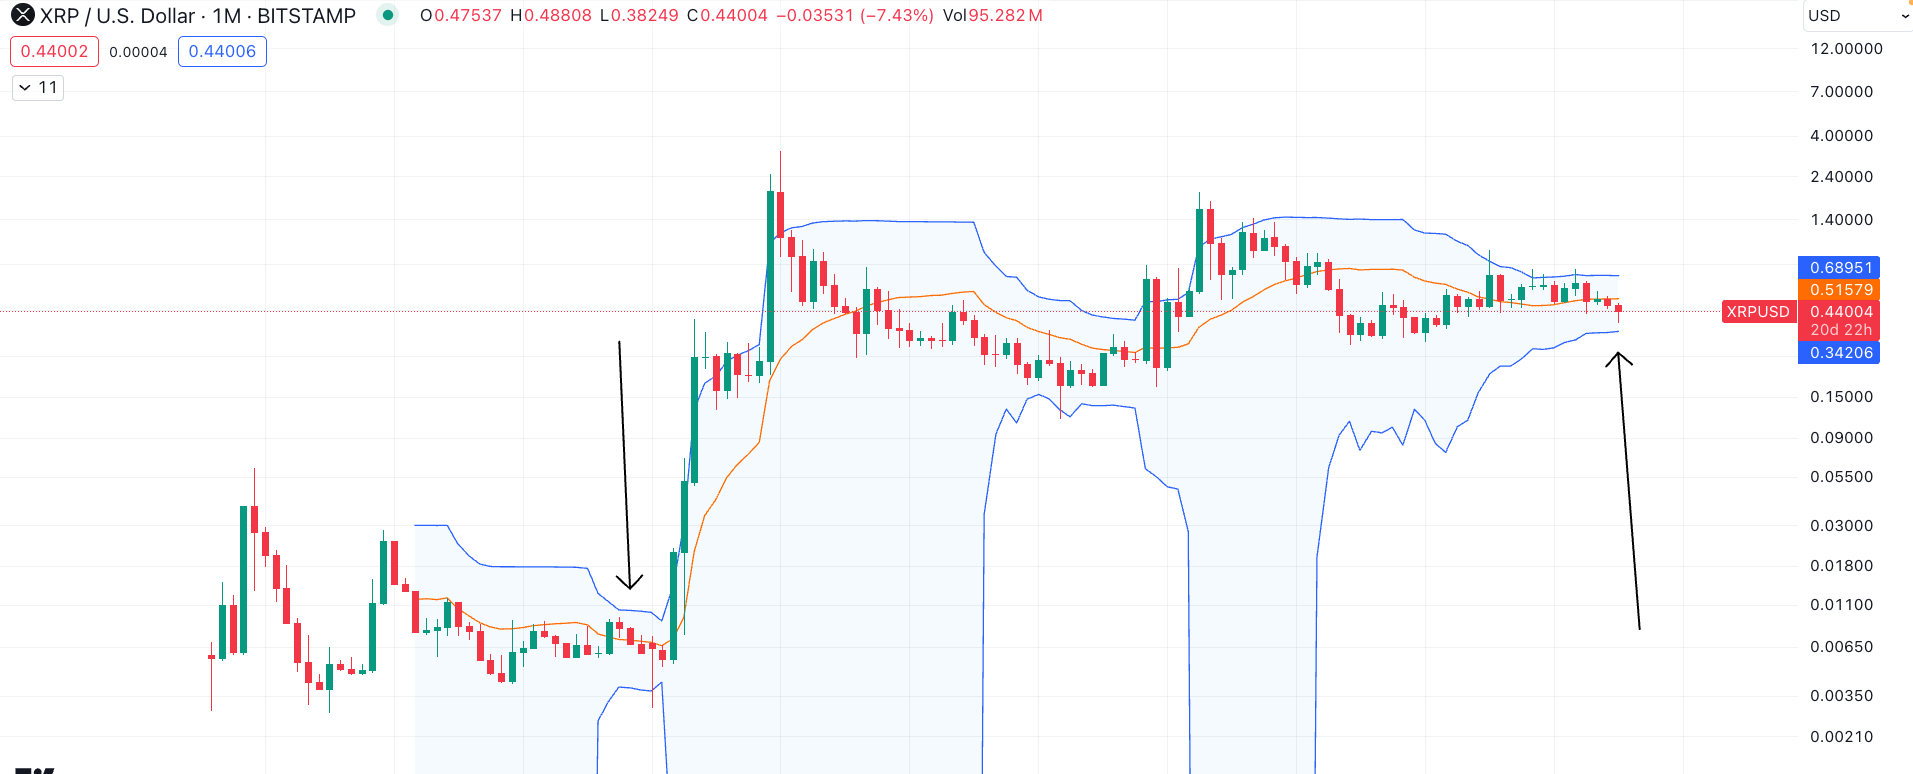
Hughes explained via X: “XRP has one of the tightest monthly Bollinger Band squeezes in its history and in all of crypto right now. The last time it squeezed like that, it shot up 60,000%.” In a YouTube video, the crypto analyst went into more detail, explaining how the XRP price has behaved in the past when the Bollinger Bands have been this tight.
XRP Could Skyrocket To $250
The first instance, according to Hughes, occurred between September 2016 and March 2017. During this period, the XRP price consolidated for several months, causing the Bollinger Bands to tighten dramatically. After this period of consolidation, the XRP price skyrocketed, achieving gains that Hughes estimates to be around 60,000%.
The second time was from December 2020 to April 2021. In this case, XRP rose by around 1,000%. “So it was much less than this period here and simply because it looks like it wasn’t as tight as it was right here [the first time], we can see it was much tighter during the first time,” Hughes explained.
Related Reading
This is the third time. Notably, “is the tightest it has ever been, even tighter than the first time, which suggests that it should explode much higher than previous cycles,” he said.
The Bollinger Bands are a technical analysis tool defined by a set of trendlines two standard deviations (positive and negative) away from a simple moving average (SMA) of a security’s price, but can be adjusted to suit the user’s preferences. A narrowing of these bands typically indicates low volatility with the potential for a major bullish or bearish price movement once the bands begin to widen again.
Hughes also examines the duration from the all-time high to the current price, noting that 2,373 days have elapsed. This long period of relative inactivity in price growth, combined with the extreme tightness of the Bollinger Bands, forms the basis of his prediction of an imminent significant move higher.
“It’s the tightest in its history as well so that just kind of proves to me that there is going to be a move…
Click Here to Read the Full Original Article at NewsBTC…


