Avalanche (AVAX) struggles to hold above key support that will set the tone for a rally to the $40 mark region anticipated by many.
The price of Bitcoin (BTC) saw a retracement as it could not break and hold above important support that corresponds with the daily 50 exponential moving average (EMA). BTC’s unable to hold that region has led to AVAX struggles to form good support.
Avax Weekly Chart Analysis
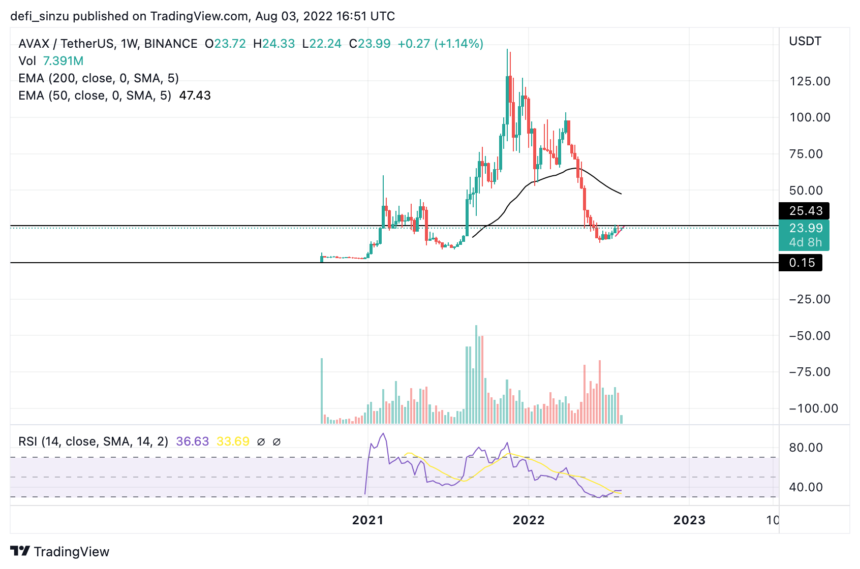
The weekly chart for Avax shows a downtrend reversal to a low of $16.3, where buyers were more willing to step into the market.
The chart shows the price of Avax needs to break and close above $23.7 for it to resume its bullish movement to the $40 mark price anticipated by investors.
Avax has formed strong support at the $16.3 mark area, with more buyers willing to place bids in this region. This region can be seen as a good demand zone should the price of Avax retraces back to the current price.
Major resistance on the weekly chart – $23.7
Major support on the weekly chart – $15
Avax Daily Chart Analysis

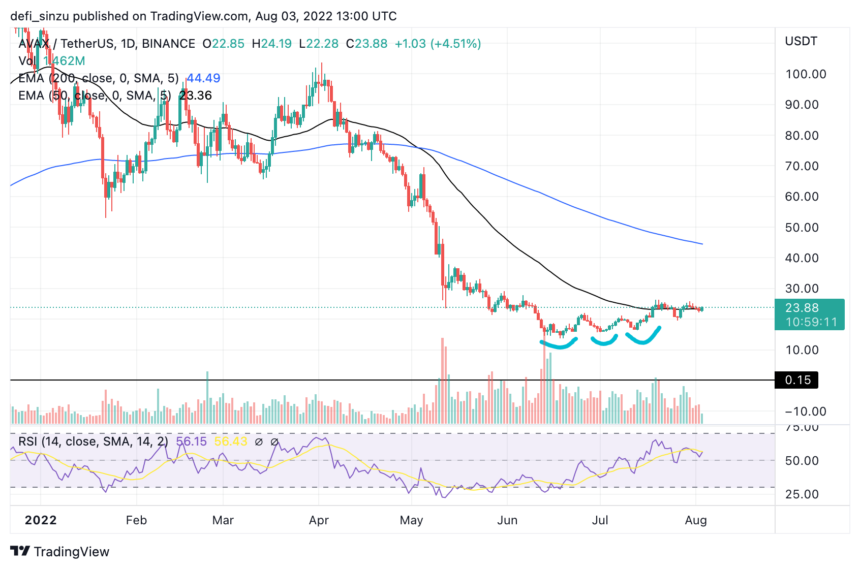
The daily chart for Avax price shows it is struggling to reclaim the 50 exponential moving average (EMA); this corresponds to a key resistance stopping the price of Avax from rallying higher.
Avax on the daily chart has good support at around $16.3 with a triple bottom formation.
A triple bottom is a bullish trend reversal formation that allows investors to accumulate more crypto assets.
With the price of Avax breaking above the 50 EMA and closing above this region would be good for bulls to push this price higher. The cost of Avax is trading below the 200 EMA, which could act as the Idea resistance for Avax when there is a clear breakout above the 50 EMA.
The price of Bitcoin is trying to reclaim the $24,000 region, which has proved difficult; a reclaim and close above this resistance with good volume would allow the price of Avax to rally with good buy volume.
The daily chart’s volume and relative strength Index (RSI) looks good, with the RSI above the 50 mark area.
Daily resistance – $24.7.
Daily support – $20.5.
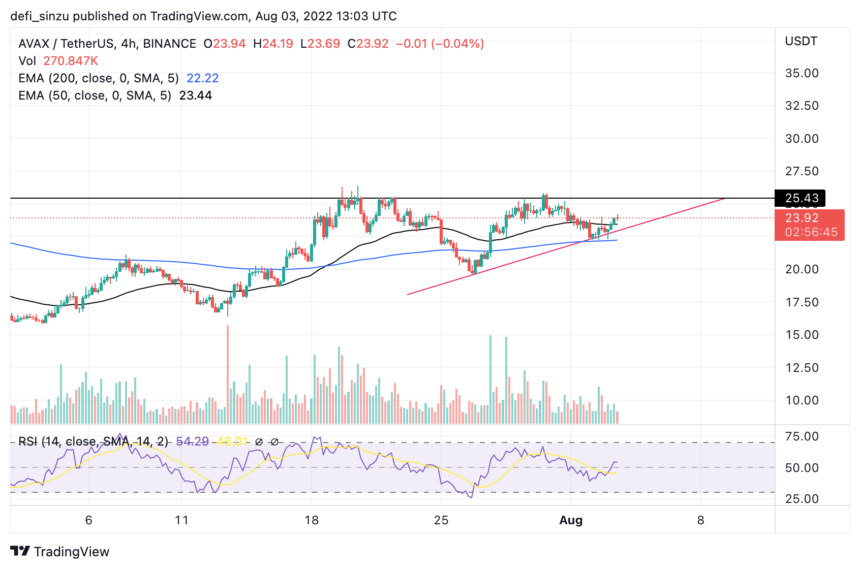
Avax Price Analysis On The 4H Chart

The price of Avax on the 4H chart shows the price has reclaimed both the 50 & 200 EMA, indicating an upward trend if all…
Click Here to Read the Full Original Article at NewsBTC…


