Renowned financial analyst John Bollinger has recently issued a caution regarding the potential for a Bitcoin pullback. After BTC price surged from below $66,000 to almost $72,000 at the beginning of the week, Bollinger, the creator of the widely utilized Bollinger Bands indicator, pointed to specific features in the Bitcoin price chart that suggest a consolidation or pullback could be imminent, though he clarified that his perspective was not bearish on a longer term.
The Bearish Argument By John Bollinger
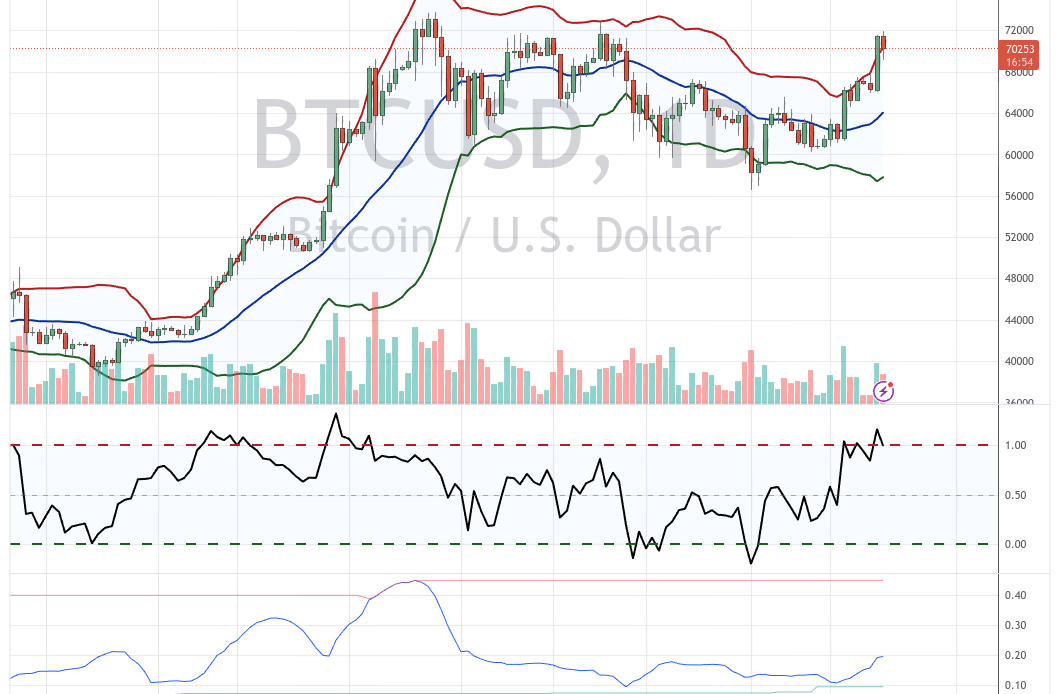
Bollinger’s analysis focuses on the daily BTC/USD chart. His main concern centers around a “two-bar reversal” pattern observed at the upper Bollinger Band. This pattern, typically indicating a potential reversal in price direction, occurs when Bitcoin’s price first exceeds the upper Bollinger Band but then closes within it during the next trading period. Such movements can imply that the upward momentum might be losing strength.
The Bollinger Bands on the chart consist of three lines: the lower band, the middle band (20-day simple moving average), and the upper band. These bands expand and contract based on price volatility, with the upper and lower bands set two standard deviations away from the middle band. The Bitcoin price peaked at approximately $71,977 on Tuesday, momentarily pushing above the upper Bollinger Band before closing back within it, forming the noted reversal pattern.
Related Reading
Further analysis shows the 20-day moving average, the middle Bollinger Band, which currently sits at about $64,564 and acts as a potential support level in the event of a price decline. Historical data from the chart indicates crucial resistance near the recent highs around $71,500, while support levels could be seen around the $64,500 mark, where the middle Bollinger Band lies, and further at $58,300, coinciding with the lower band.
The expansion of the Bollinger Bands indicates increased market volatility, particularly as the price tests resistance levels. The Relative Strength Index (RSI) is currently just at 63, which is not yet in the overbought territory.
In his commentary, Bollinger has clearly stated that while the setup is not fundamentally bearish, the observed technical pattern warrants caution for short-term traders. He advises monitoring for either a consolidation period where the price stabilizes, or a pullback where it retreats from recent highs. “I am…
Click Here to Read the Full Original Article at NewsBTC…


