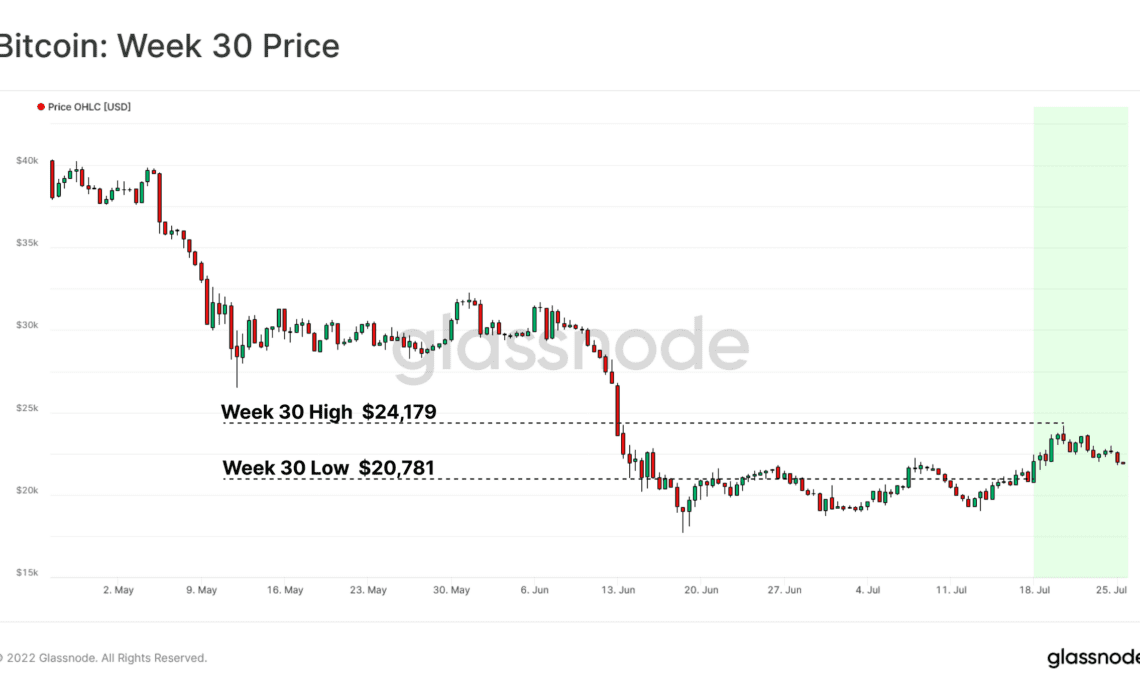
On July 26, Bitcoin (BTC) price dropped below $21,000, giving back the majority of the gains accrued in the previous week and returning to the $23,300 to $18,500 range that Glassnode analysts describe as “the Week 30 high and Week 30 low.”
A handful of analysts and traders attribute the July 26 to July 27 Federal Open Market Committee (FOMC) meeting and the expected Federal Reserve rate hike as the primary reasons for the current sell-off.
Barring the announcement that the United States economy has entered a recession, a few traders believe that the expected 75 to 100 basis point (BPS) hike will be followed by a relief rally that could see BTC, Ether and other large-cap altcoins snack back to the top of their current range. Of course, this sentiment reflects more speculation than sound analysis, so take it with a grain of salt.
Given that BTC price is simply continuing to trade in the same range that it has been in for the past 42 days, the real question is whether the market will bring more consolidation or another round of capitulation.
In its July 26 on-chain newsletter, Glassnode analysts posit that investors can find their “conviction through confluence” of multiple technical and on-chain metrics which suggest the peak of capitulation has long past.
According to the analysts, rapid deleveraging threw many metrics into “extreme statistical deviations” and with the worst of the selling possibly behind us, Bitcoin price returning to the high $20,000 zone was expected.
Glassnode notes that the:
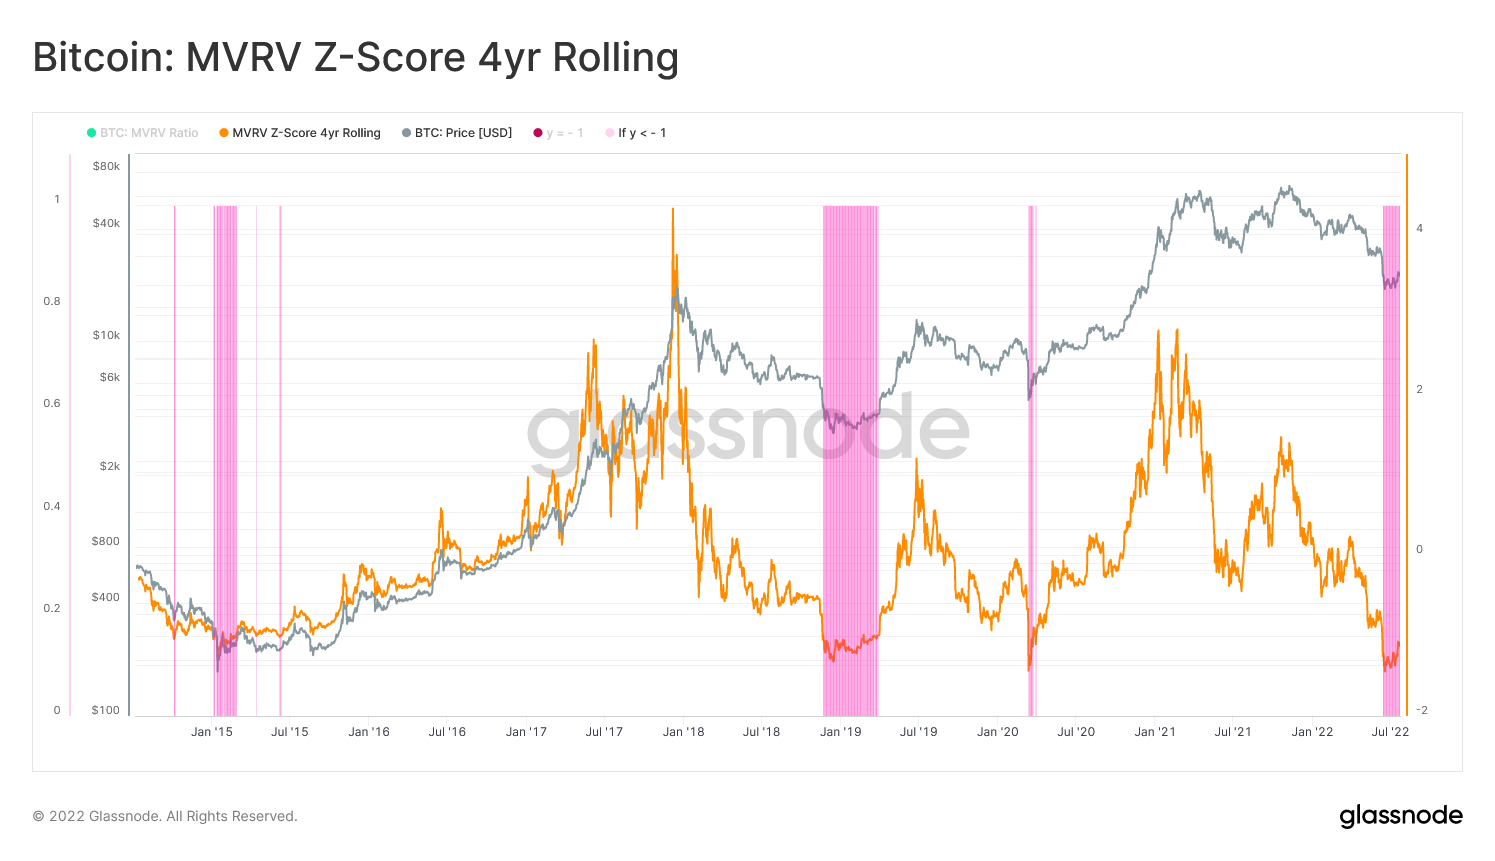
“The June leg down in price action has produced the lowest 4-yr rolling Z-Score value on record.”
And the analysts explained that the 4-year rolling MVRV Z-score “signaled undervaluation for all bear cycle bottoms, including 2015, 2018, and the March 2020 flash crash.”
When compared against various cohorts of long and short-term sellers, and metrics like Realised Price, Mayer Multiple and longer-term daily and weekly moving averages, Glassnode suggests that confluence in the indicators when compared against historical data point to growing bullish momentum and signs of a bottom.
On-chain data spots a bottom, but what does technical analysis say?
From the perspective of technical analysis, Bitcoin’s move to $24,200 presented a brief breakout from the current range, but the inability to sustain momentum at this level presented the…
Click Here to Read the Full Original Article at Cointelegraph.com News…


