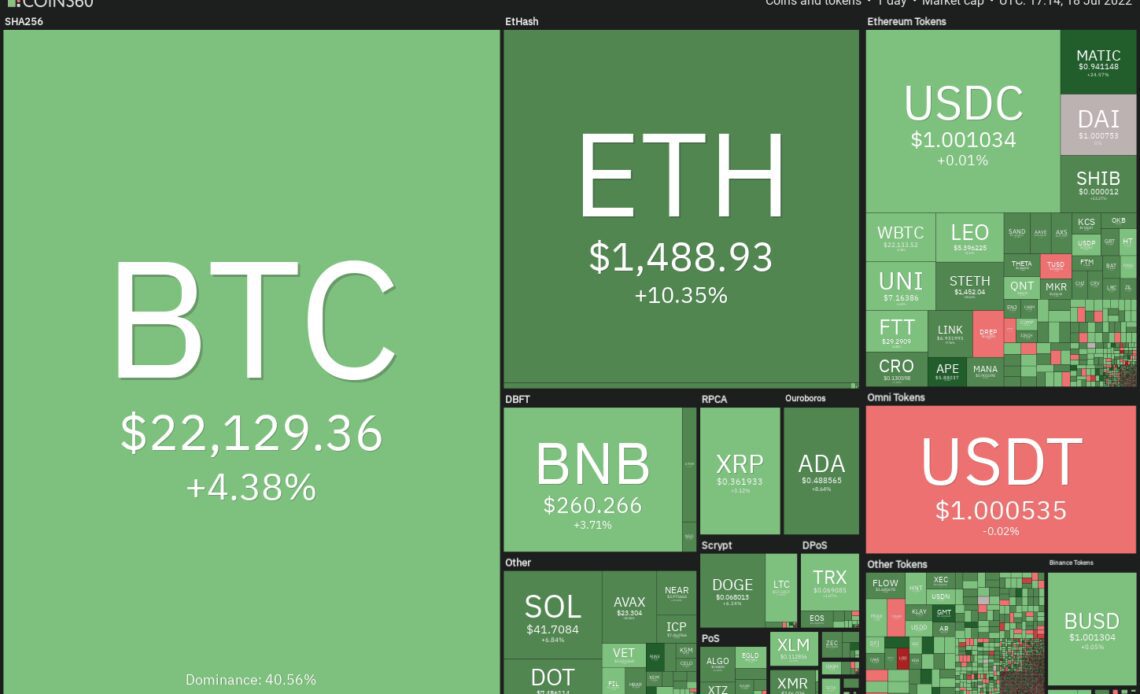
Bitcoin (BTC) rose above $22,000 and Ether (ETH) traded above $1,500 on July 18, indicating that bulls are gradually returning to the cryptocurrency markets. This pushed the total crypto market capitalization above $1 trillion for the first time since June 13, raising hopes that the worst of the bear market may be behind us.
In another positive sign, more than 80% of the total Bitcoin supply denominated in the United States dollar has been dormant for at least three months, according to crypto intelligence firm Glassnode. During previous bear markets, such an occurrence preceded the end of the bear phase.
However, a report by Grayscale Investments voices a different opinion. It suggests that the current bear market in Bitcoin started in June 2022 and if history repeats itself, the bear phase could continue for 250 more days.
Could buyers maintain their momentum at higher levels or will bears continue to sell on rallies? Let’s study the charts of the top-10 cryptocurrencies to find out.
BTC/USDT
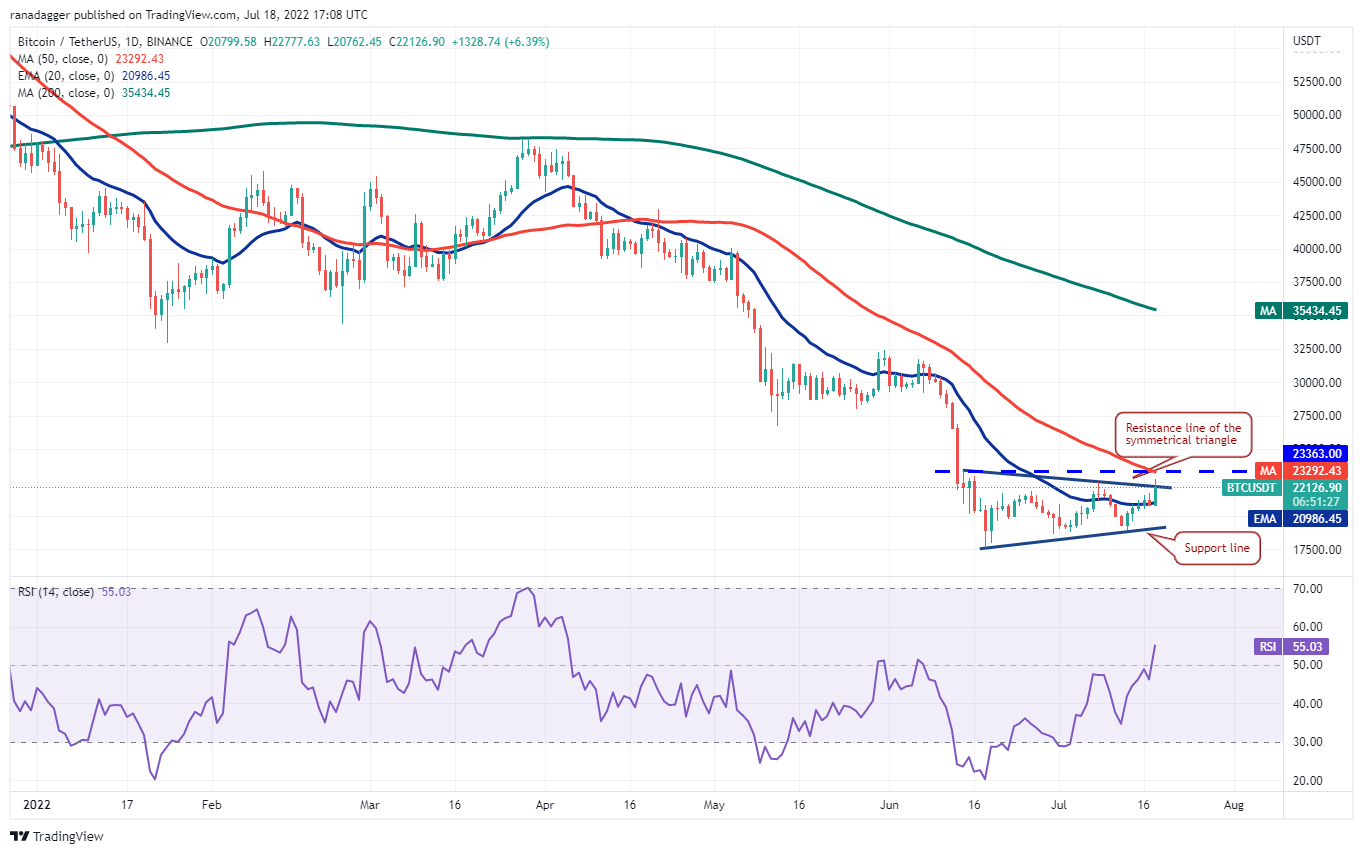
After hesitating near the 20-day exponential moving average ($20,986) for two days, Bitcoin made a decisive move higher on July 18. This up-move has broken above the resistance line of the symmetrical triangle, indicating a possible trend reversal.

The 20-day EMA is flat but the relative strength index (RSI) has risen into the positive territory indicating that the momentum favors the buyers. The bulls will now attempt to overcome the barrier at $23,363.
If the price turns down from this level but rebounds off the breakout level from the triangle, it will suggest buying at lower levels. That could increase the possibility of a break above $23,363. The pair could then rally to the pattern target of $28,171.
Conversely, if the price fails to sustain above the triangle, it will indicate that the bears are aggressively defending the overhead zone between the resistance line of the…
Click Here to Read the Full Original Article at Cointelegraph.com News…


