Bitcoin (BTC) has finally pushed above the $17,000 mark after rallying to $17,375 on Jan. 12. with both the bulls and the bears eyeing the Consumer Price Index (CPI) due on Jan. 12. If the print shows that inflation is cooling off, risk assets may rally, but a negative surprise could attract strong selling.
While some believe that a macro bottom could be forming in Bitcoin, others remain skeptical. They draw a parallel between the current bear market and the dot-com bubble burst. The United States Federal Reserve stopped raising rates in May 2000 but the Nasdaq did not bottom out for two more years. If the same scenario plays out with cryptocurrencies, then the next bull run may not start in a hurry.
However, one positive for the future of the crypto industry is that legacy finance companies continue to show interest in the space. Laser Digital co-founder and CEO Jez Mohideen believes that the arrival of traditional companies could help regulate the cryptocurrency sector.
Do the charts signal a rally in Bitcoin? What are the other altcoins that are showing a positive chart structure? Let’s find out.
BTC/USDT
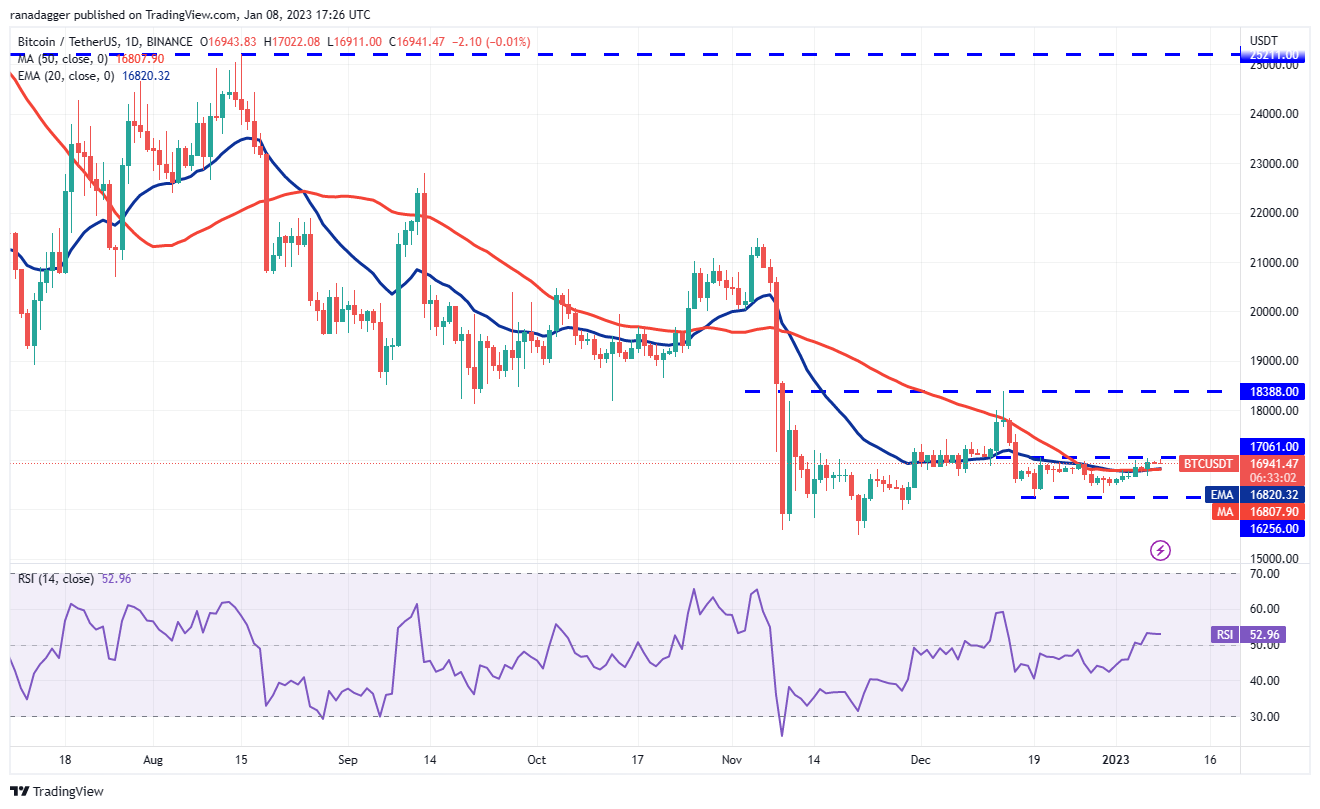
Bitcoin has been trading above the moving averages since Jan. 4. This is the first indication that the selling pressure could be reducing. The price reached the overhead resistance at $17,061 on Jan. 6 but the bulls could not ascend this level. This indicates that the bears have not given up yet.

A minor positive in favor of the bulls is that they have not allowed the BTC/USDT pair to tumble below the moving averages. If the price consolidates between the moving averages and $17,061 for some time, the prospects of a break above the overhead resistance could improve. If bulls kick the price above $17,061, the pair could surge toward $18,388.
Alternatively, if the price turns down and slumps below the moving averages, it will indicate that the pair could remain stuck between $17,061 and $16,256 for a few more days.

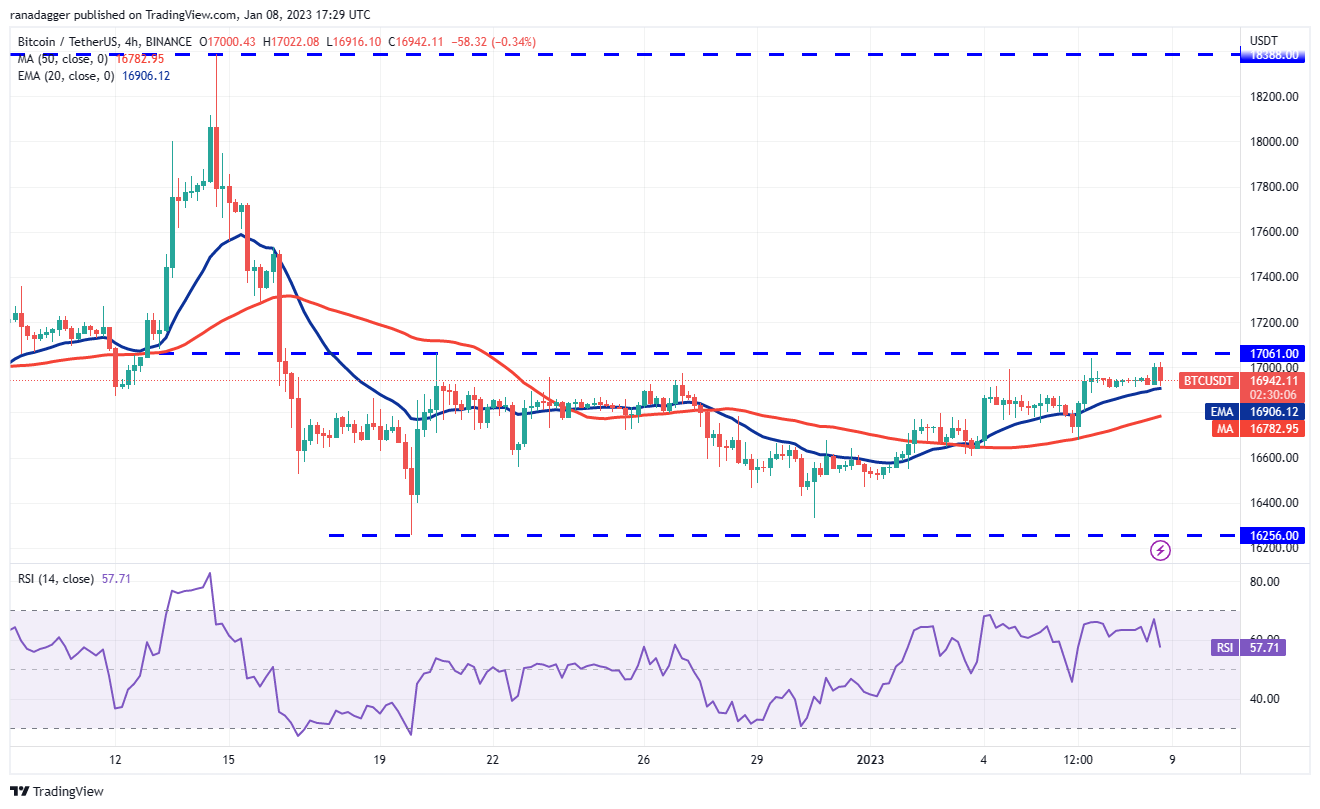
The 4-hour chart shows that bears are guarding the $17,061 level but they have not been successful in pulling the price below the 20-exponential moving average. This suggests that buyers are not rushing to the exit as they expect a break above the overhead resistance.
The gradually upsloping 20-EMA and the relative strength index (RSI) in the positive territory indicate that buyers have a slight edge. A break above…
Click Here to Read the Full Original Article at Cointelegraph.com News…


