The S&P 500 and the Nasdaq Composite fell to a new year-to-date low last week and closed the week with a loss of 1.55% and 3.11% respectively.
The scenario changed drastically on Oct. 17 after earnings season ramps up and a sharp policy reversal from UK finance minister Jeremy Hunt added detail to the government’s plan to fix his predecessor’s (Kwasi Kwarteng) fiscal package which triggered a record fall in the value of the GBP and a near liquidation of pension plans in the United Kingdom.
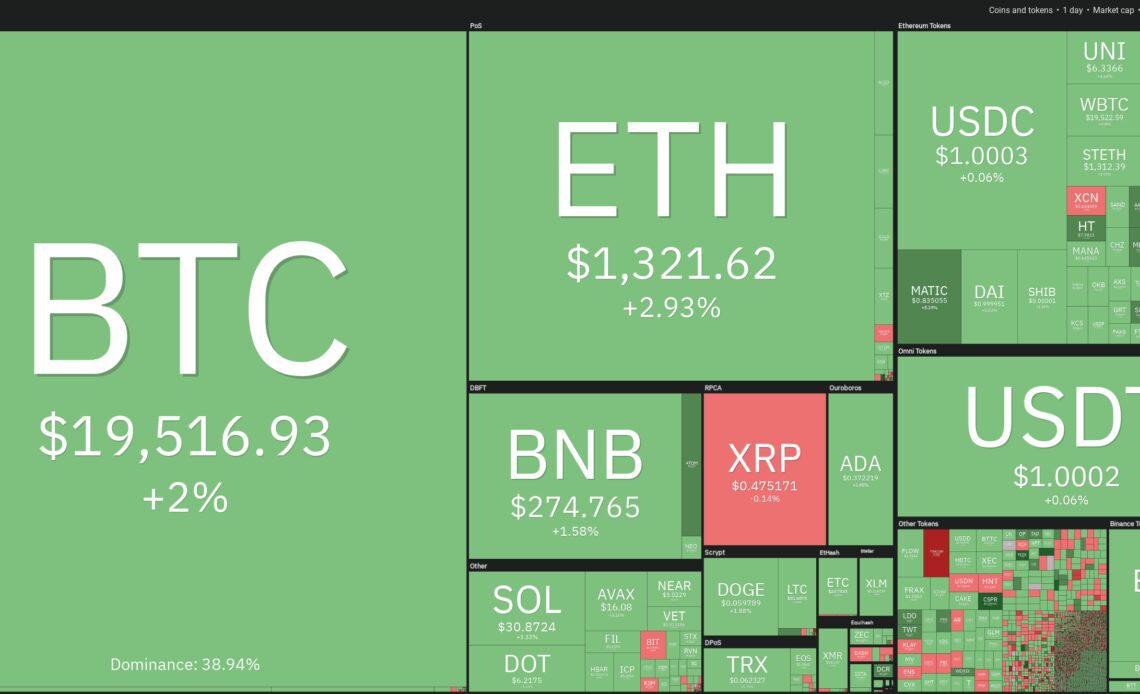
At the time of writing, the Dow is up 1.78%, while the S&P 500 and Nasdaq present 2.57% and 3.26% respective gains. Meanwhile, Bitcoin (BTC) has managed to stay well above its year-to-date low showing short-term outperformance.
Some analysts expect that Bitcoin could be closer to a bottom. Twitter trader Alan said that the stochastic indicator on Bitcoin’s monthly chart has reached levels similar to that seen during the 2014 and 2018 bear markets, indicating a likely macro bottom.
Similarly, LookIntoBitcoin creator Philip Swift said in an interview with Cointelegraph that Bitcoin could be close to major cycle lows. Citing various metrics, Swift said that Bitcoin may face another two to three months of pain but should start its outperformance in 2023.
As Bitcoin sustains above its June low, select altcoins are attracting buyers. Let’s look at the charts of five cryptocurrencies that look interesting in the near term.
BTC/USDT
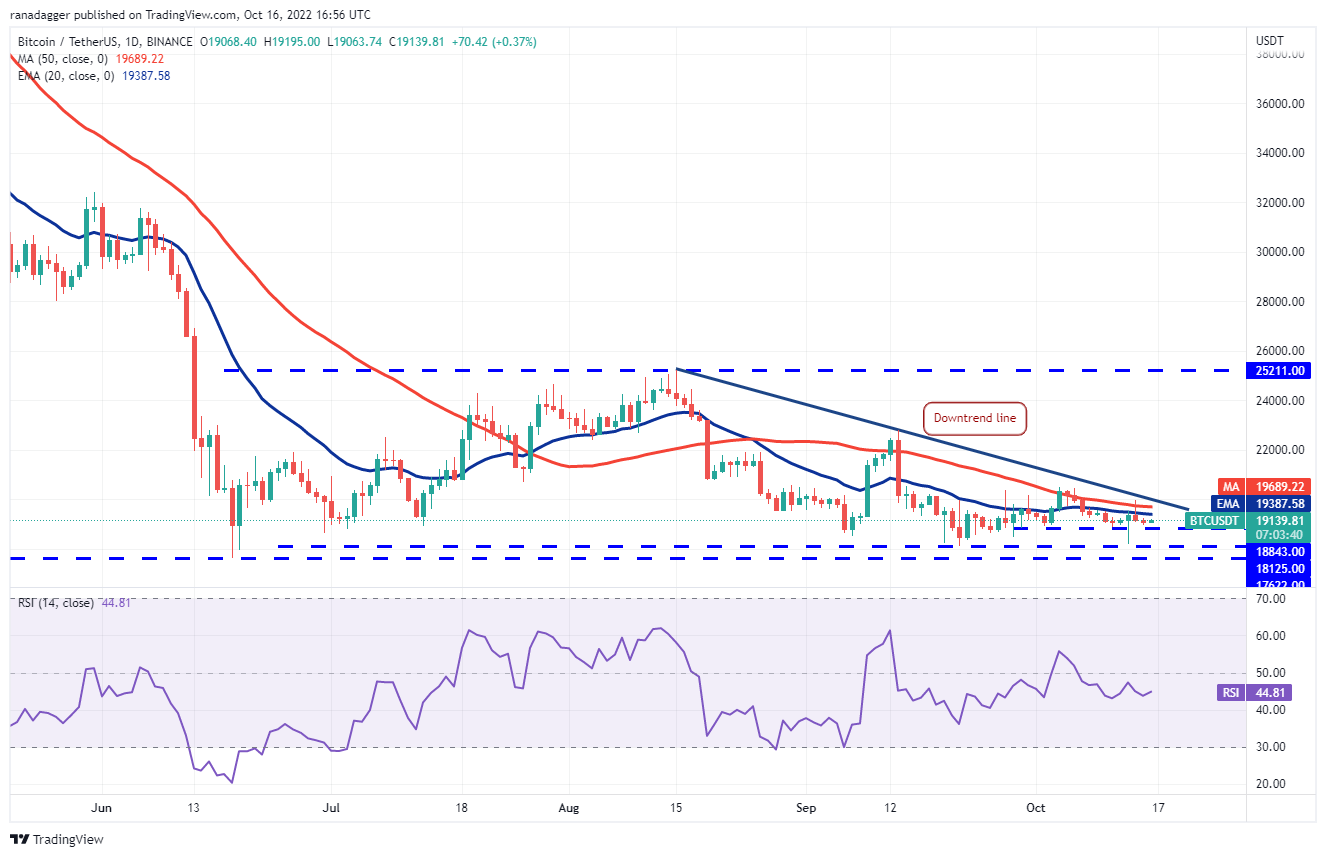
Bitcoin broke above the 50-day simple moving average ($19,689) on Oct. 14 but the higher levels attracted heavy selling by the bears. That pulled the price back below the 20-day exponential moving average ($19,387).

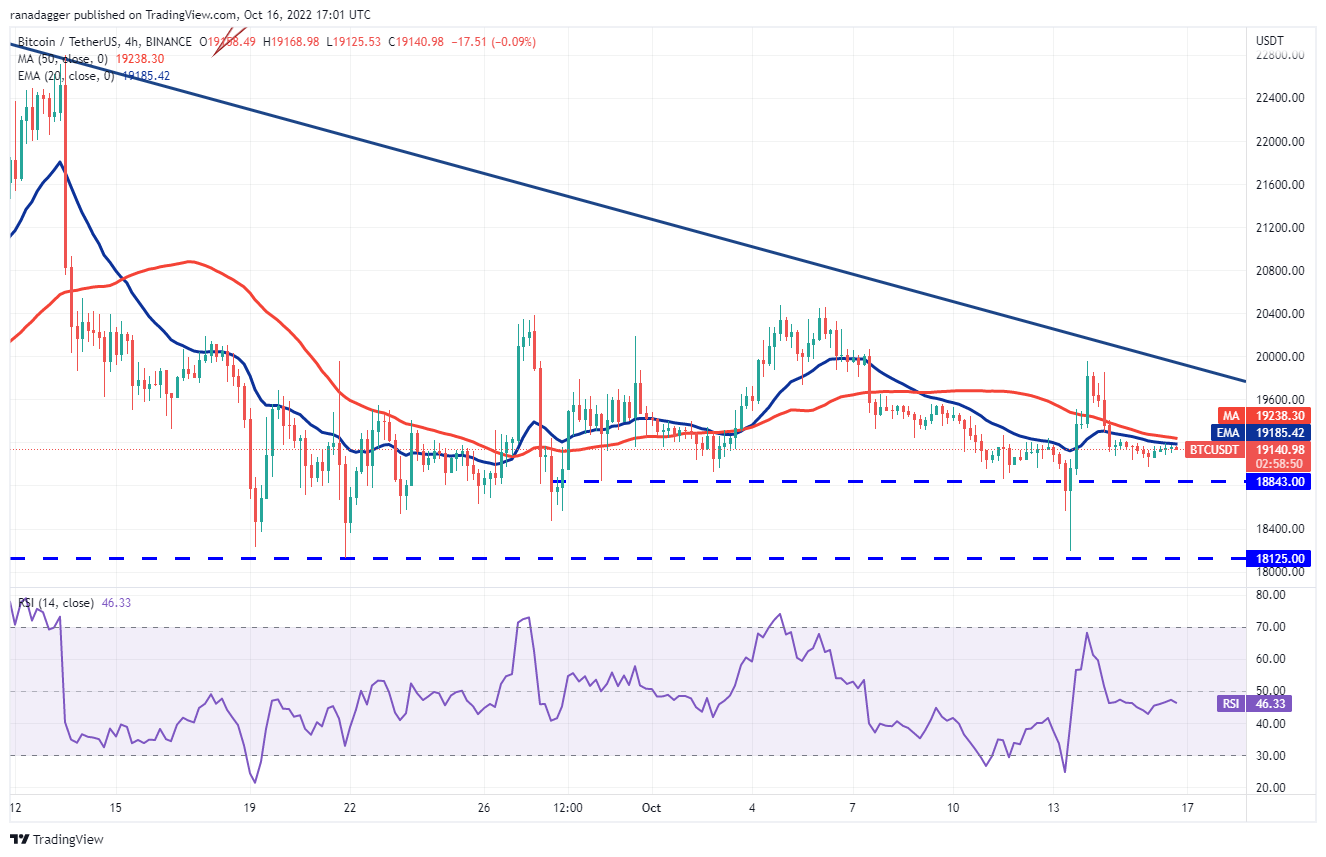
Buyers are trying to defend the immediate support at $18,843 but the recovery could face resistance at the 20-day EMA and then at the downtrend line. If the price turns down from the overhead resistance, the possibility of a break below $18,843 increases. The pair could then plummet to the $18,125 to $17,622 support zone.
To avoid this catastrophe, the bulls will have to force the price above the downtrend line. If they manage to do that, the BTC/USDT pair could rally to $20,500. A break above this resistance could signal the start of a relief rally to $22,800.

The pair has been stuck between $18,125 and $20,500 for some time. If bulls push the price above the moving averages, the pair could climb up to $20,000 and then to $20,500. The bears may mount a…
Click Here to Read the Full Original Article at Cointelegraph.com News…


