The Bitcoin landscape is no stranger to debates and predictions. Two dominant theories are currently at the forefront: the 4-Year Cycle and the Elliot Impulse Wave. However, a comprehensive analysis by the esteemed crypto analyst CryptoCon, suggests a fascinating intersection of these two theories.
The Dueling Bitcoin Price Prediction Theories
At the heart of the debate are two camps. The first, the 4-Year Cycle proponents, believe in Bitcoin’s 4-year journey from cycle tops to bottoms, with a predicted zenith in 2025. The second camp, the Elliot Impulse Wave advocates, are forecasting a powerful parabolic top either this year or by early 2024.
CryptoCon’s meticulous analysis, which encompasses TA, on-chain data, market psychology, and more, offers a fresh perspective. “I believe it may be possible to see the best of both worlds for each group of thinkers,” he posited.
A significant portion of the 4-Year Cycle theory hinges on the halving’s impact on Bitcoin’s price. “When the Bitcoin supply is reduced approximately every 4 years, this should trigger a supply decrease which causes price to rise,” CryptoCon elucidated. However, he also raised a counterpoint, noting the diminishing influence of miner supply output on Bitcoin’s price, especially given its current market size.
Historical Parallels, Signals And Indicators
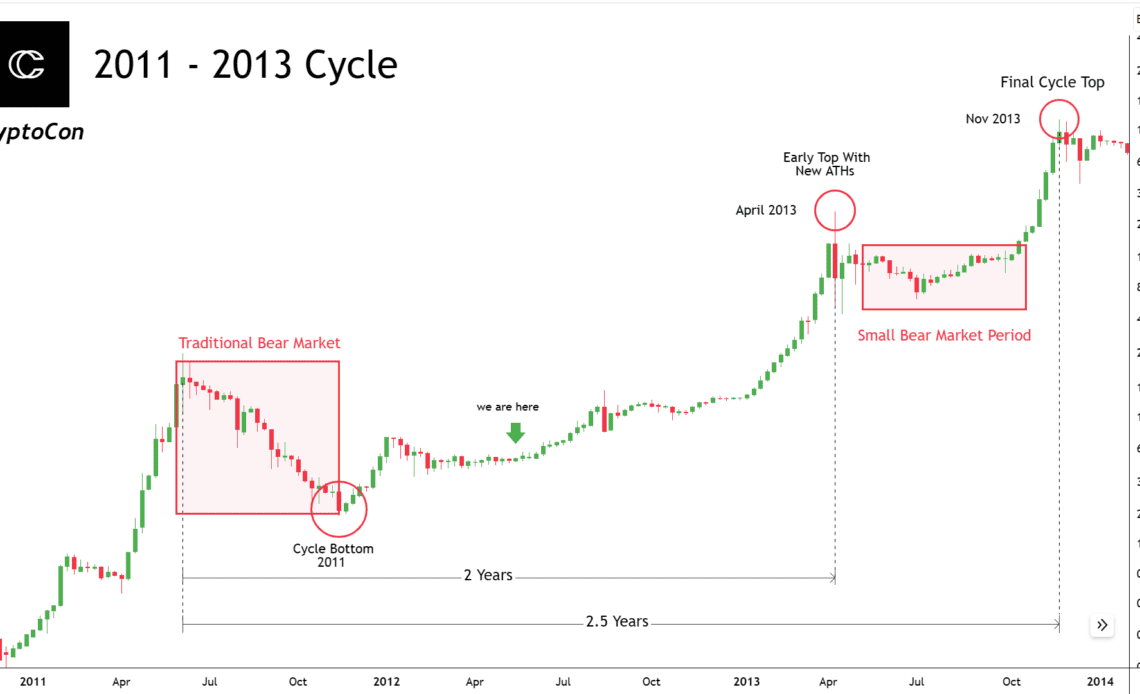
CryptoCon drew attention to the 2011-2013 cycle, a period that didn’t adhere to traditional patterns. This cycle experienced both an early and a later top. Could this be a precedent for the current cycle? “Both of these groups of people seem to forget one particular cycle that seemingly defied all of the rules. 2011 – 2013,” he recalled.
Two compelling signals were central to his analysis: the DXY Correlation Coefficient and the Vigor Signal. Historically, these have been precursors to a price parabola. “The parabola signal has triggered. This has been the start of every price parabola by definition,” he emphasized, underscoring their reliability. Historically, when Bitcoin has shown a low correlation with the US dollar, significant price movements have been observed.
The November 28th Cycles Theory, rooted in the date of Bitcoin’s first halving, has also been a consistent predictor of Bitcoin’s price movements for a decade. It segments the Bitcoin price journey into four distinct phases: Green, Blue, Red, and Orange years…
Click Here to Read the Full Original Article at NewsBTC…


