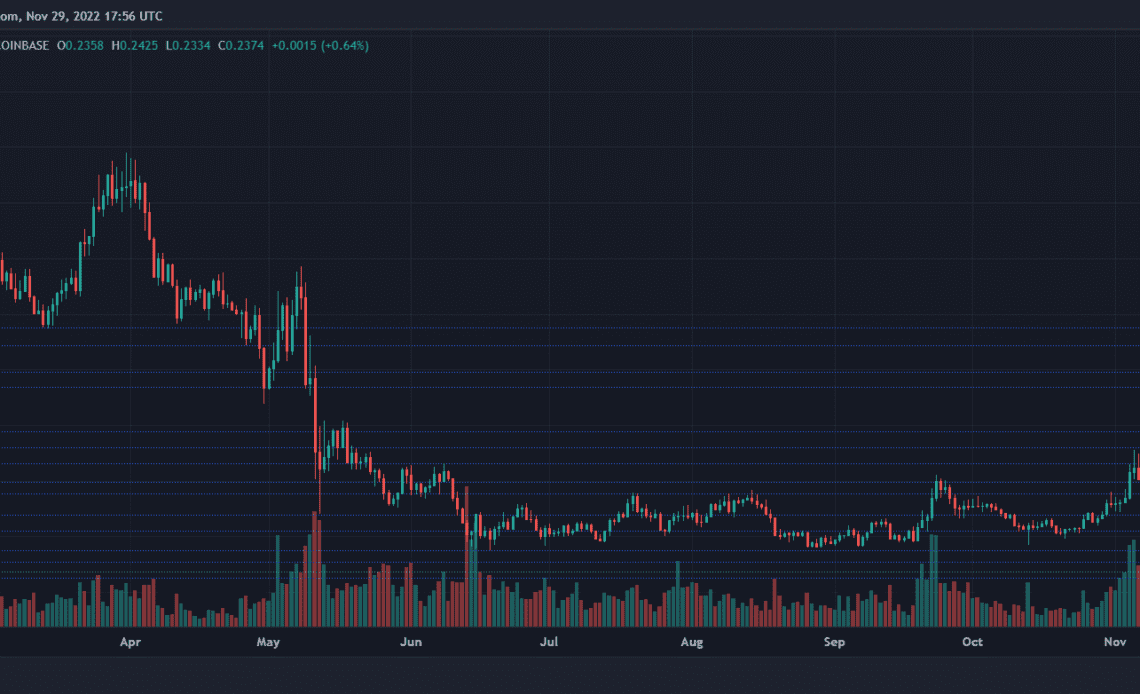
Algorand price continues to pack negative price action throughout the month of November. The altcoin has depreciated by more than 40% since the beginning of this month. Over the last 24 hours, ALGO has just risen by 0.6% on its chart, emphasizing continued lateral price movement.
Currently, the coin has been stuck at a crucial resistance level. The technical outlook points in a direction where ALGO might not make a price comeback soon enough. The buying pressure has dropped considerably, which has reflected the fact that the coin has been undergoing a massive sell-off. If Algorand is to come under bullish influence, buyers have to immediately re-enter the market.
The asset’s price action is expected to become even more congested at the $0.20 level if the bears halt movement above the $0.23 mark again. It remains to be seen if Algorand reclaims the $0.24 price level.
Algorand Price Analysis: One-Day Chart
ALGO was auctioned at $0.23 at the time of writing. The overhead price ceiling was $0.24, and the altcoin faced rejection every time it inched toward that zone. With the massive sell-off, Algorand can lose the $0.23 price level and pierce through the $0.22 mark to sit on $0.20 for some time.
The altcoin can be expected to trade at $0.22 for some time before it targets $0.20, and if buyers return, ALGO can trace upwards from the $0.22 price mark. The amount of Algorand traded in the past session decreased, highlighting the sell-off.
Technical Analysis
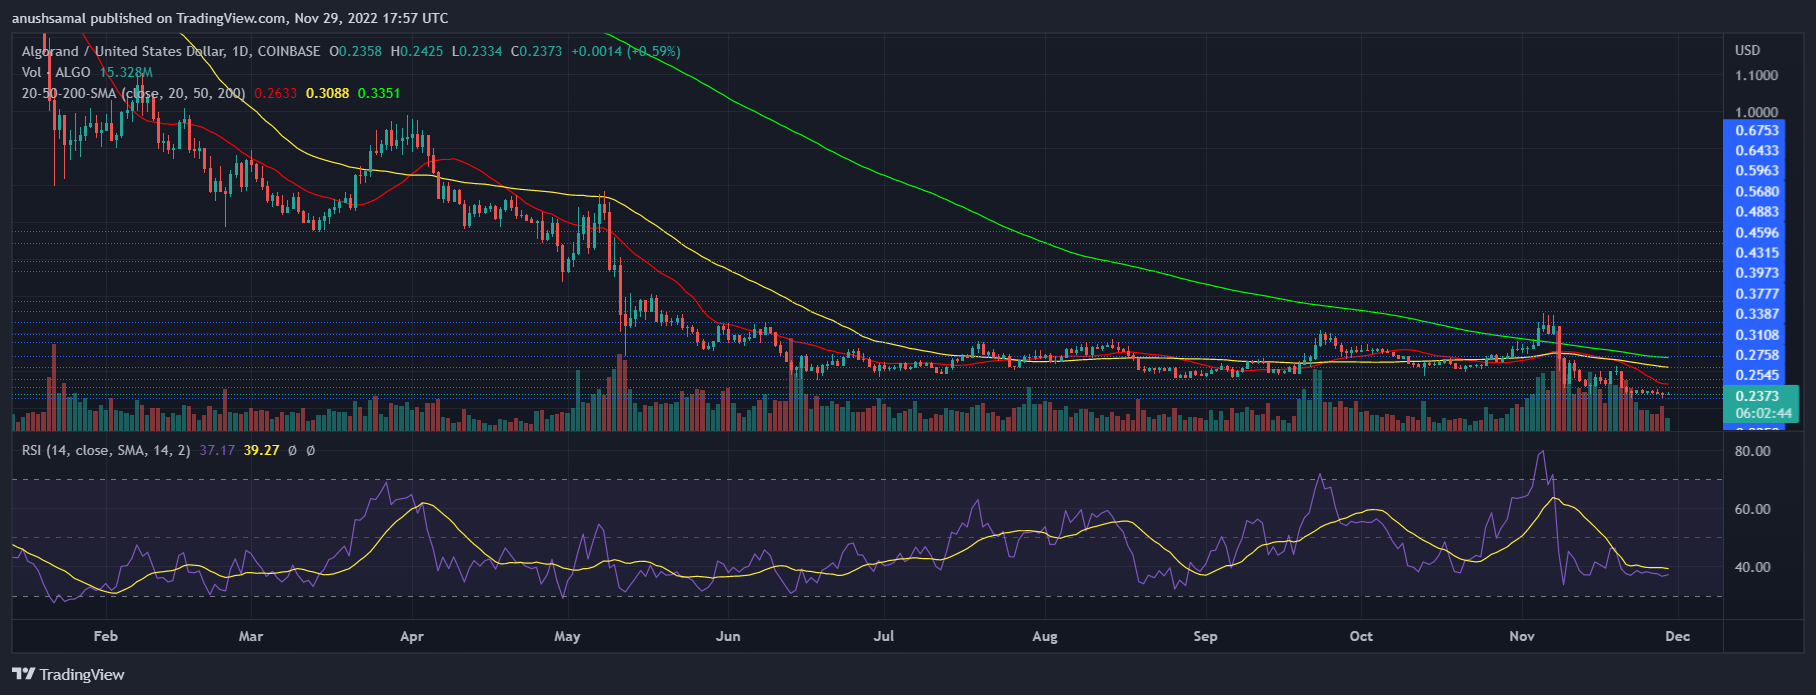
For most of this month, Algorand’s price has witnessed the pull of the sellers. Algorand was overvalued at the beginning of the month, although the bulls could not hold onto the price momentum. The Relative Strength Index was below the 40 mark, which signifies that the asset was even below the neutral zone, indicating that buying strength was weak.
Corresponding to the same reading, ALGO remained under the 20-Simple Moving Average (SMA). If the price of the coin moves above the 20-SMA, then the bearish thesis could be invalidated. According to the 20-SMA reading, sellers were driving the price momentum.
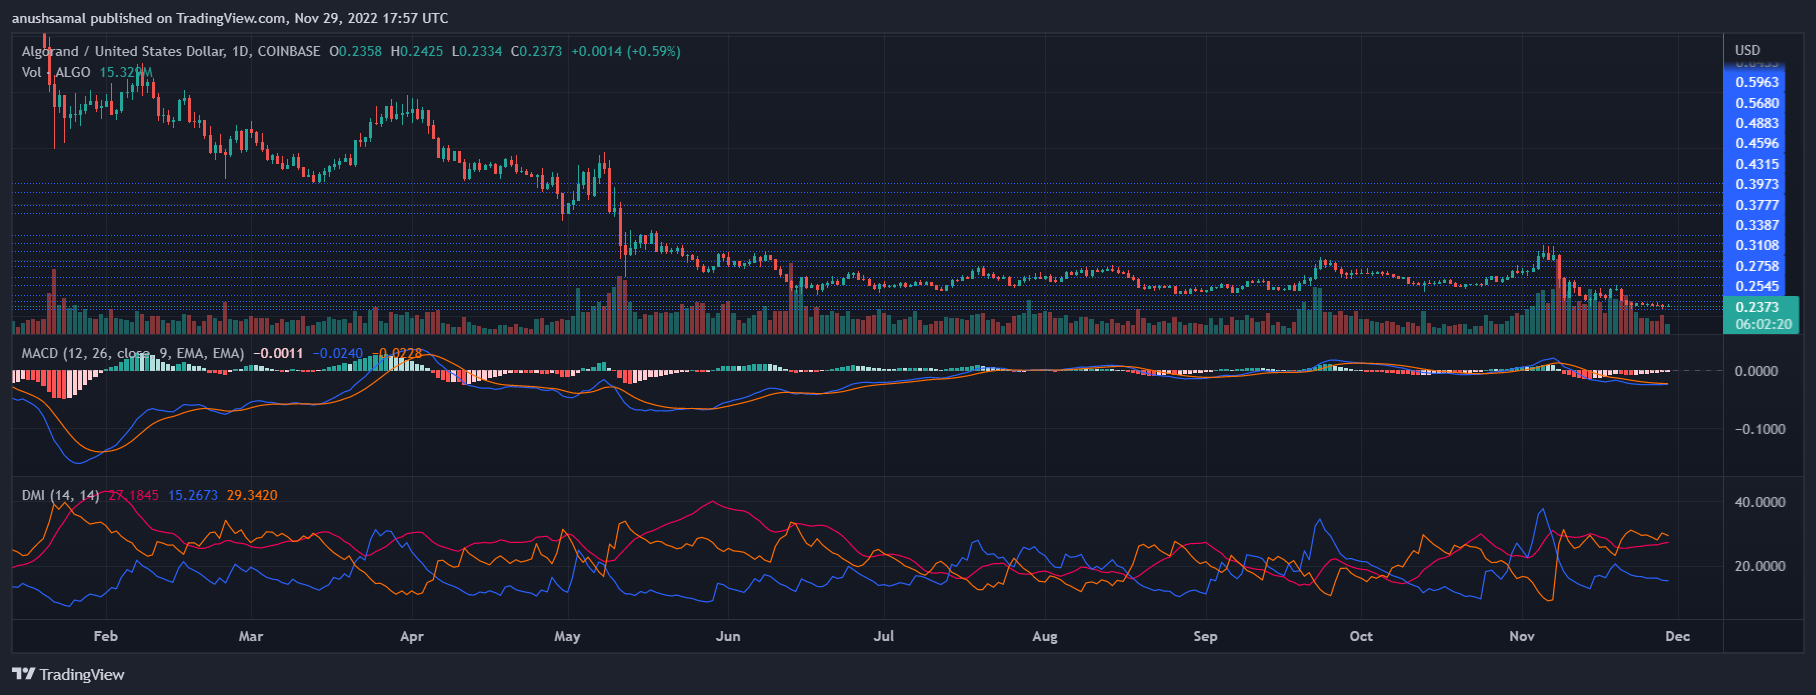
On the 24-hour chart, ALGO’s Moving Average Convergence Divergence (MACD) shows the price trend and the chance of a momentum reversal. MACD…
Click Here to Read the Full Original Article at NewsBTC…


