Solana rallied over 20% and surpassed $15 against the US Dollar. SOL price is showing positive signs and might rise further above the $16.80 resistance.
- Sol price started a fresh increase above the $12 and $15 levels against the US Dollar.
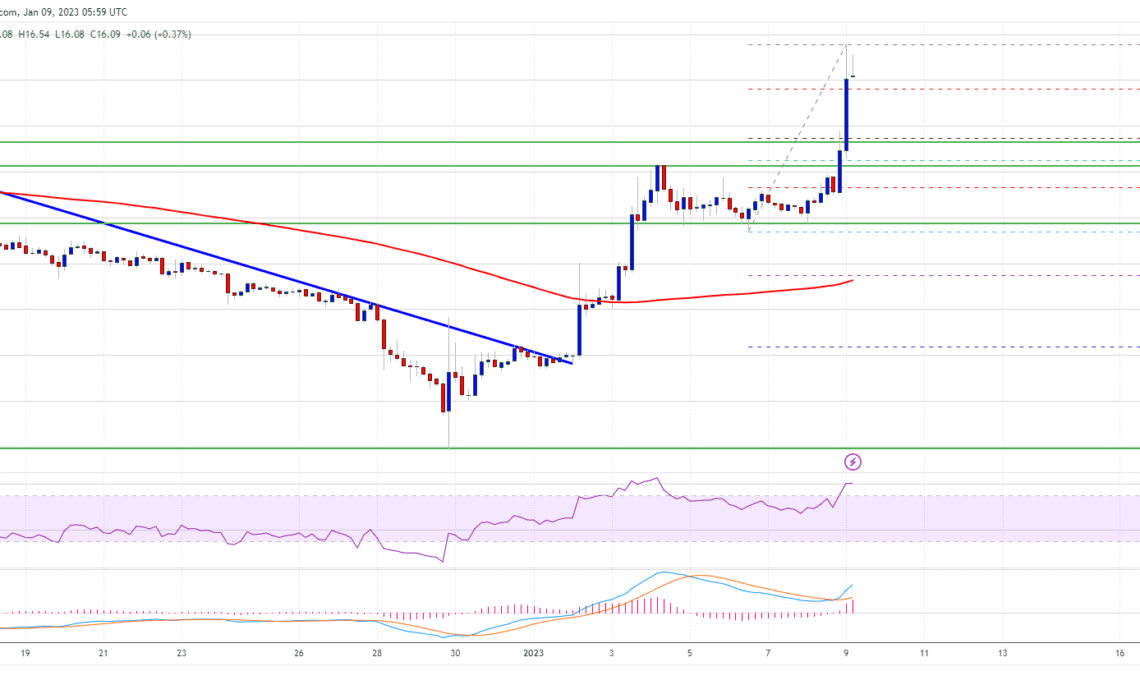
- The price is now trading above $15 and the 100 simple moving average (4-hours).
- There was a break above a major bearish trend line with resistance near $10.20 on the 4-hours chart of the SOL/USD pair (data source from Kraken).
- The pair could rise further if it stays above the $14.50 and $14.10 support levels.
Solana Price Gains Bullish Momentum
This past month, solana price saw a strong decline from the $15 resistance zone. There was a drop below the $12.50 and $10 support levels to move into a bearish zone again.
The price traded as low as $7.96 and recently started a fresh increase. There was a strong move above the $10 and $12 resistance levels. Besides, there was a break above a major bearish trend line with resistance near $10.20 on the 4-hours chart of the SOL/USD pair.
Sol price is now trading above $15 and the 100 simple moving average (4-hours). The price is up over 20% and is showing positive signs, similar to bitcoin and ethereum.
Source: SOLUSD on TradingView.com
It is trading above the 23.6% Fib retracement level of the upward move from the $12.87 swing low to $16.77 high. On the upside, an immediate resistance is near the $16.80 level. The first major resistance is near the $17 level. The next major resistance is near the $18 zone, above which the price might rise towards the $20 barrier. Any more gains might send the price towards the $25 level.
Downsides Supported in SOL?
If SOL fails to clear the $16.80 resistance, it could start a downside correction. An initial support on the downside is near the $15.80 level.
The first major support is near the $14.75 level. It is near the 50% Fib retracement level of the upward move from the $12.87 swing low to $16.77 high. The next major support is near the $14.10 level. If there is a downside break below the $14.10 support, the bears might even push the price below $13.50.
Technical Indicators
4-Hours MACD – The MACD for SOL/USD is gaining pace in the bullish zone.
4-Hours RSI (Relative Strength Index) – The RSI for SOL/USD is currently in the overbought zone.
Major Support Levels – $15.80, $14.75 and $14.10.
Major Resistance Levels – $16.80, $18 and $20.
Click Here to Read the Full Original Article at NewsBTC…


