Polkadot price seems to be returning on its feet, courtesy of recent developments. DOT’s network released its newest update, highlighting some core developments that could pave a path for its foundational roadmap for 2023.
Polkadot has plans to delve deeper into smart contract development through its project Substrate. This focuses on the network’s intention to bring more utility. DOT has also expressed interest in wanting to enter the NFT section. Looking at the technical outlook, the coin has picked up on some positive price action. Over the last 24 hours, DOT moved upward, albeit slowly.
This slow price movement could be attributed to broader market weakness. The buyers seemed to pick up the pace, indicating increased demand for the asset. To correspond with the same sentiment, DOT registered a significant increase in its market cap.
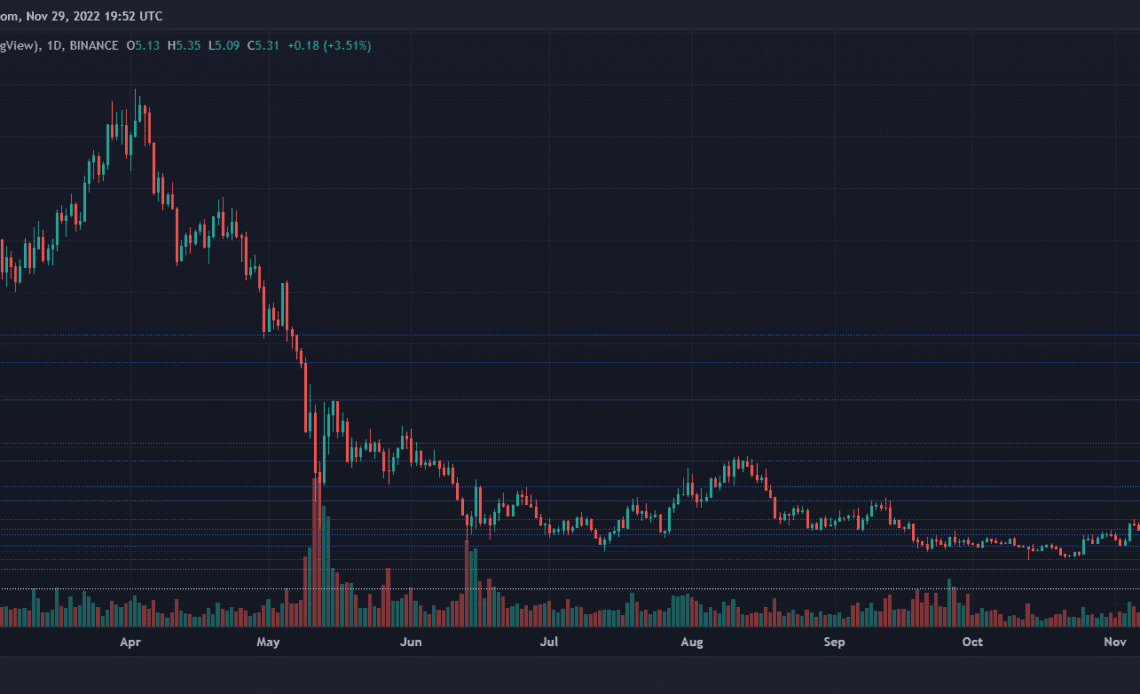
Polkadot Price Analysis: One-Day Chart
DOT was trading at $5.31 at press time. The altcoin has been sandwiched between the $5 and the $5.6 zone for weeks. The increase in accumulation, however, makes it seem as though Polkadot might be able to breach the overhead resistance of $5.70.
In the event of breaching the immediate resistance, DOT might also reach $6.21, giving investors significant gains. On the flip side, if DOT remains stuck under the $5.60 mark for too long, demand will wane, resulting in depreciation. Polkadot’s next stop would be $4.50 in that case.
Technical Analysis
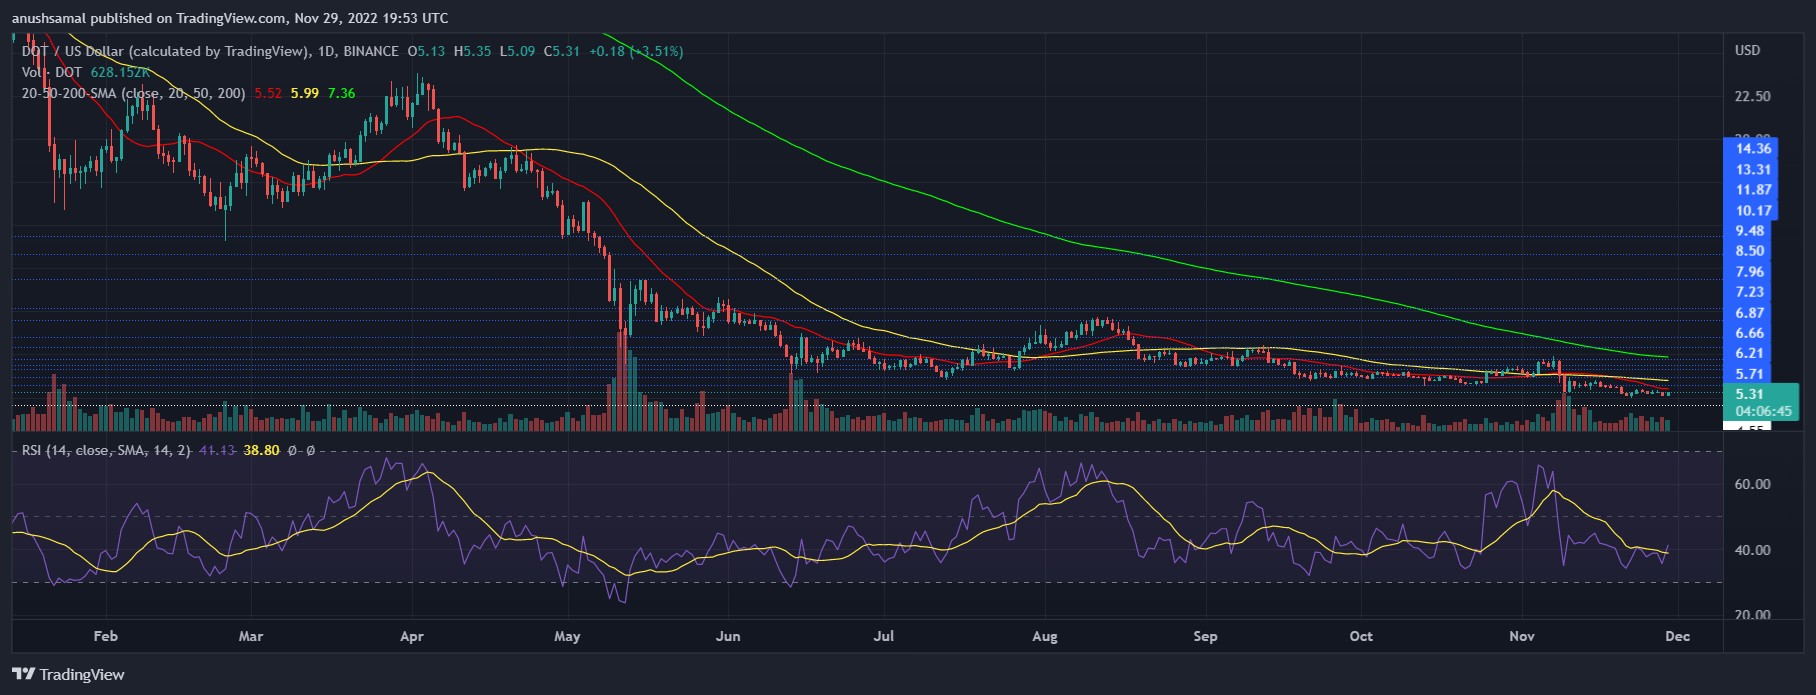
DOT has registered a slow uptick in buying strength in the last few weeks. At press time, the chart witnessed a surge in buyers. The Relative Strength Index showed a rise as the indicator moved past the 40-mark and closer to the neutral zone.
This was a sign of increased demand and incoming positive price action. On the same note, Polkadot was attempting to move above the 20-Simple Moving Average line due to an increase in buying strength. However, the reading reflected that sellers were still in control and driving the price momentum.
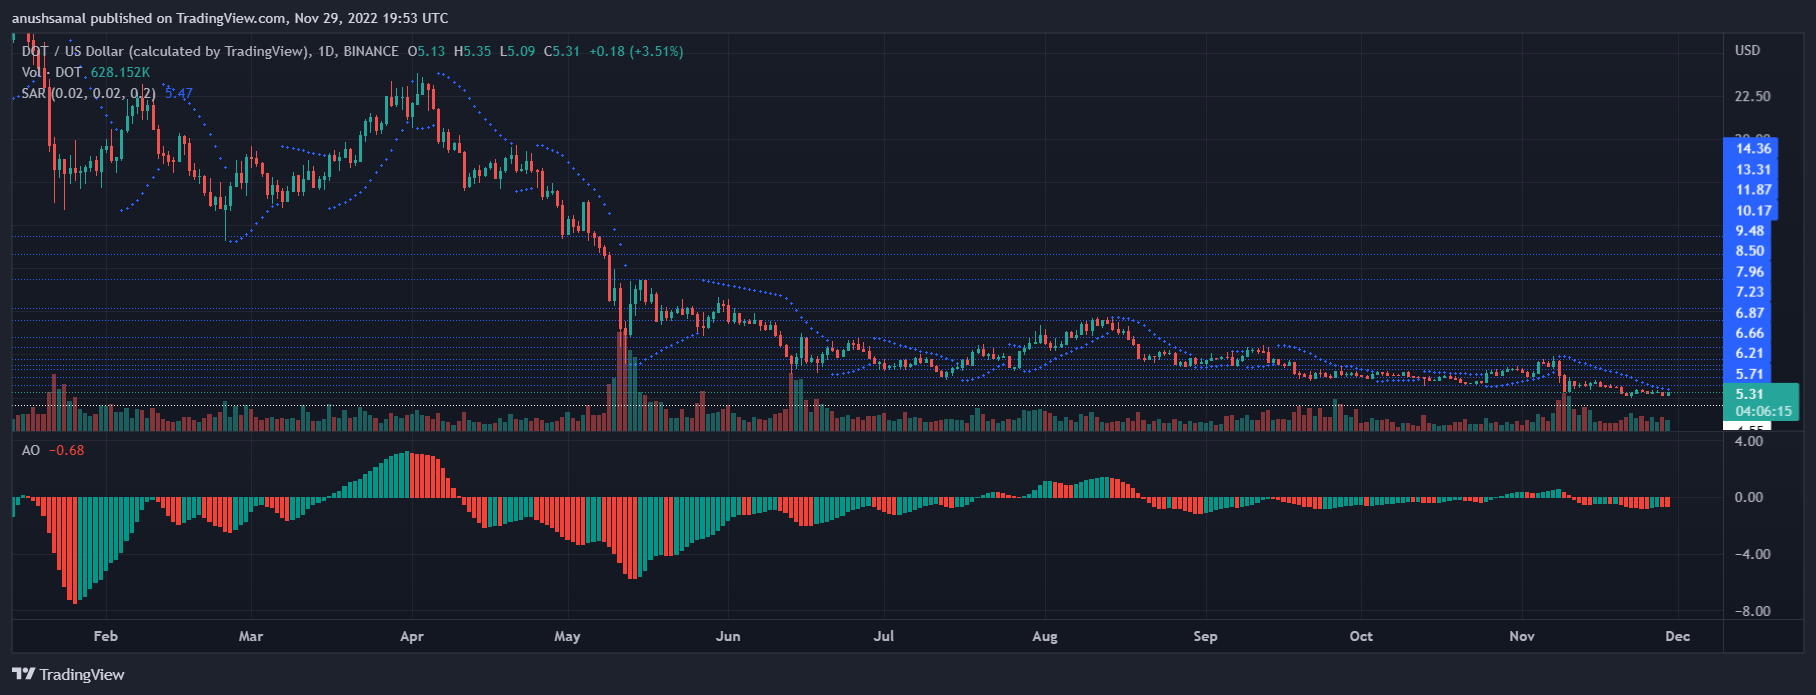
In correspondence to the Simple Moving Average, DOT received sell signal on the 24-hour chart. The Awesome Oscillator indicates its price momentum and strength. The indicator formed red signal bars underneath the neutral line, which were sell…
Click Here to Read the Full Original Article at NewsBTC…


