On-chain data shows miners have sent a large amount of Bitcoin to spot exchanges recently, something that can be bearish for the value of the crypto.
Bitcoin Miners To Spot Exchanges Flow Has Surged Up Over The Past Day
As pointed out by an analyst in a CryptoQuant post, the latest spike in the miner exchange deposits is larger than any other recent peaks.
The relevant indicator here is the “miners to spot exchanges flow mean,” which measures the total amount of Bitcoin being transferred by miners to spot exchanges.
When the value of this metric shoots up, it means miners have just sent a large number of coins to exchanges. Since these chain validators usually deposit to spot markets for selling purposes, this kind of trend can prove to be bearish for the price of BTC.
On the other hand, the value of the indicator being low suggests there aren’t many transactions happening from miner wallets to centralized exchange wallets. Such a trend can be either neutral or bullish for the value of the coin as it implies there isn’t much selling pressure coming from this cohort right now.
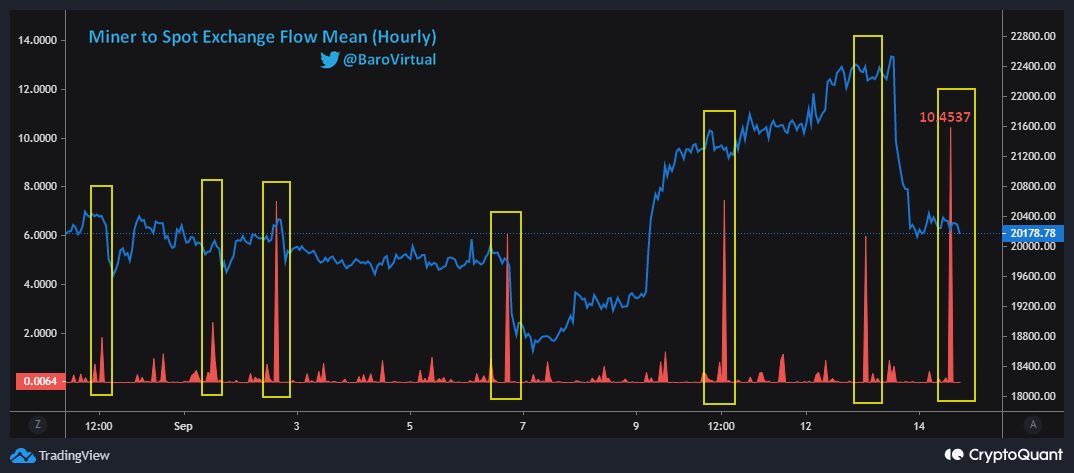
Now, here is a chart that shows the trend in the Bitcoin miners to spot exchanges flow mean over the last couple of weeks:
The hourly value of the metric seems to have been quite high in recent days | Source: CryptoQuant
As you can see in the above graph, the Bitcoin miners to spot exchanges flow mean has observed a huge spike during the past day.
The last two weeks saw several exchange inflows coming from miners, after each of which the price generally suffered a short-term decline.
This latest increase in the miner spot deposits is significantly larger than any other seen in this period, and has come while the price has already plunged down. This is unlike the previous ones, which came as the price was around a peak.
If the same trend as the previous miner exchange inflows follows this time as well, then these fresh deposits are also likely to have a bearish impact on Bitcoin.
BTC Price
At the time of writing, Bitcoin’s price floats around $20.1k, up 4% in the last seven days. Over the past month, the crypto has lost 17% in value.
Below is a chart that shows the trend in the price of the coin over the last five days.
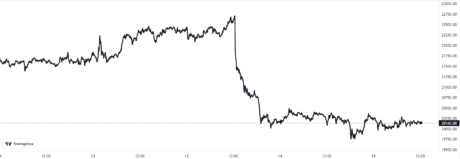
Looks like the value of the crypto plummeted down a few days back and has since moved sideways | Source: BTCUSD on TradingView
Featured image from Brent Jones on Unsplash.com, charts from TradingView.com, CryptoQuant.com
…
Click Here to Read the Full Original Article at NewsBTC…


