In technical analysis, a flag pattern indicates short-term price movements inside a parallelogram coounter to the previous long-term trend. Traditional analysts view flags as potential trend continuation indicators.
There are two types of flag patterns: bull flag and bear flag. While their outcomes are different, each flag exhibits five key characteristics, as listed below:
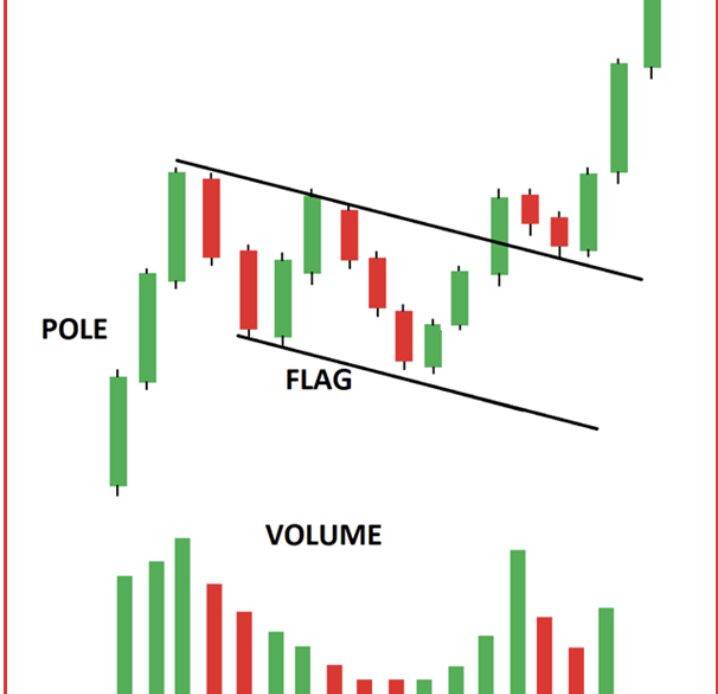
- The strong preceding trend (flagpole or pole)
- The consolidation channel (the flag itself)
- The trading volume pattern
- A breakout
- A confirmation of the price moving in the direction of its previous trend.
In this article, we discuss bull and bear flag patterns and how to trade them.
What is a bull flag pattern?
A bull flag is a technical pattern that appears when the price consolidates lower inside a downward-sloping channel after a strong uptrend. The said channel comprises two parallel, rising trendlines. Kindly note that the pattern could be a wedge or a pennant if the trendlines converge.
The volume typically dries up during consolidation, implying that traders associated with the preceding trend have less urgency to buy or sell during the consolidation period.
The urgency to jump in by new and old investors, or “FOMO” (fear of missing out), typically returns when the price breaks above the bull flag’s upper trendline, thus boosting trading volumes.
As a result, analysts view strong volumes as a sign of a successful bull flag breakout.
On the other hand, lackluster volumes when the price breaks above the bull flag’s upper trendline increase the possibility of a fakeout. In other words, the price risks dropping below the upper trendline, thus invalidating the bullish continuation setup.
Trading a bull flag setup
Traders can enter a long position at the bottom of a bull flag in anticipations that the price’s next run-up toward the pattern’s upper trendline will result in a breakout. The more risk-averse traders can wait for a breakout confirmation before opening a long position.
As for the upside target, a bull flag breakout typically prompts the price to rise by as much as the flagpole’s size when measured from the flag’s bottom.
The following Bitcoin (BTC) price pattern between December 2020 and February 2021 shows a successful bull flag breakout setup.
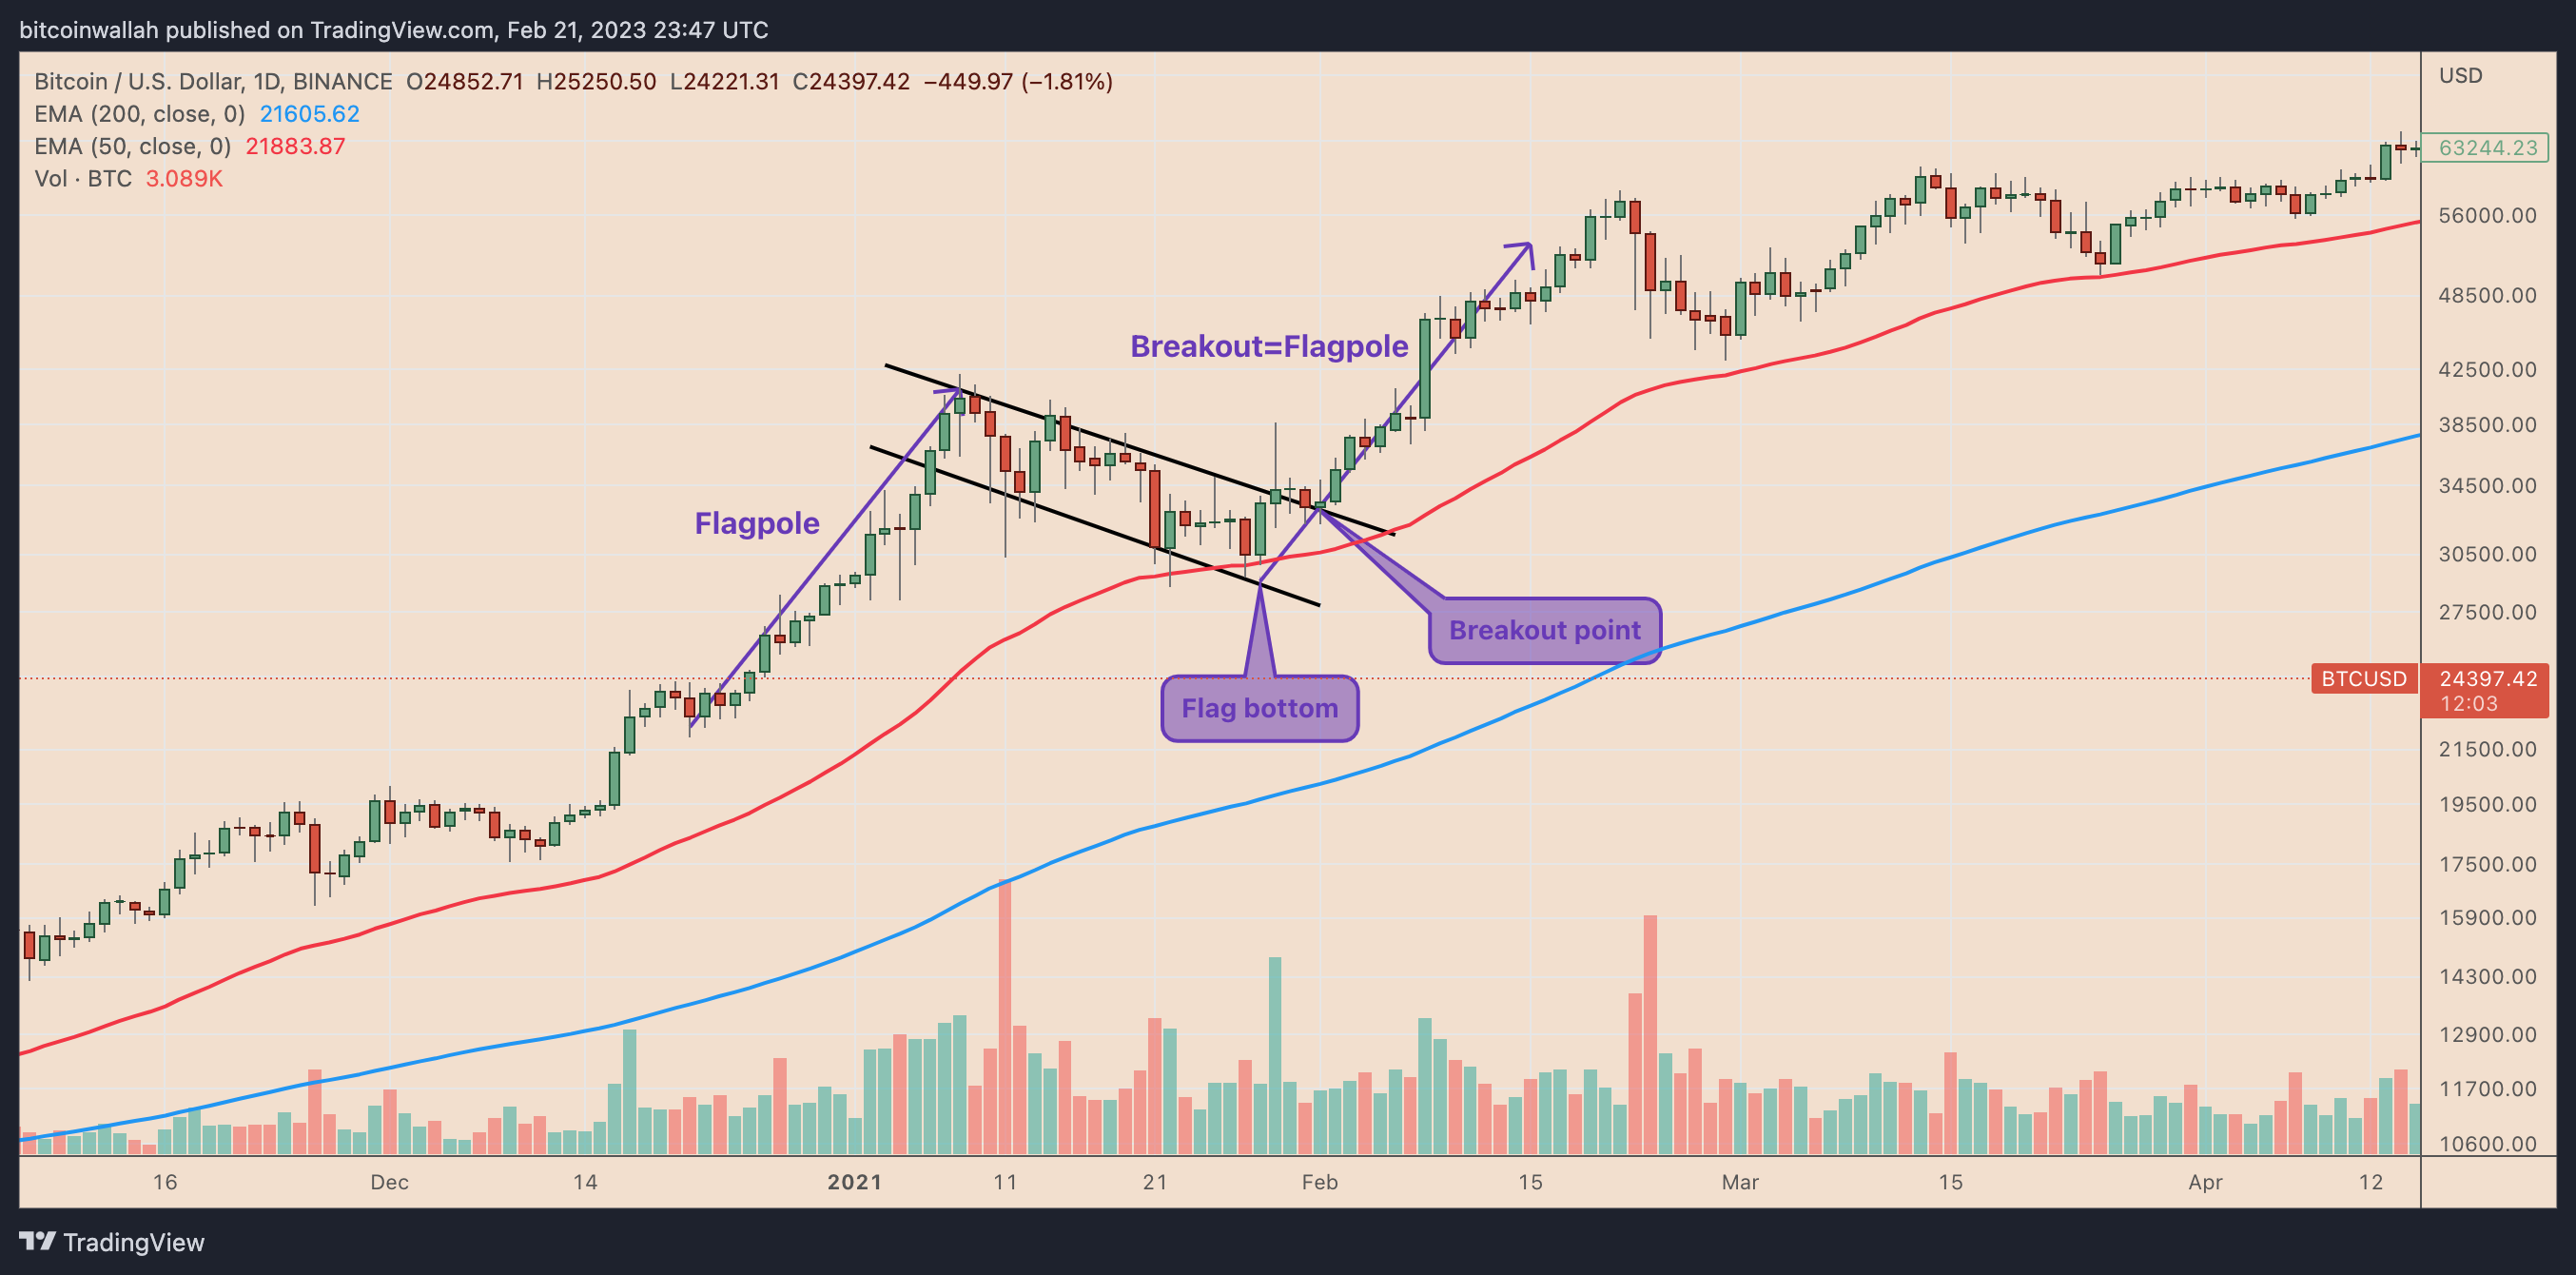
As a note of caution, traders should maintain their risks by placing a stop loss just below their entry levels. That will enable them to reduce their losses if the bull flag…
Click Here to Read the Full Original Article at Cointelegraph.com News…


