Trading the crypto market can be tough and requires more than buying and selling crypto assets; if you aim to become a successful investor and trader in this field, this requires skills, patience, and psychology to stay ahead of the game. Investors and traders are always looking for ways to stay profitable in crypto by adopting different trading strategies, using indicators, oscillators, and chart patterns to have an edge and remain profitable in a bullish and bearish market. Studies have shown that the crypto market ranges by over 70%, while the remaining percentage allows traders to spot trending opportunities. Let us discuss the Exponential Moving Average (EMA), one of the widely used indicators by traders and investors to remain profitable and ride massive trends in the crypto market.
What Is Exponential Moving Average (EMA)
The Exponential Moving Average is a type of Moving Average tool employed in the technical analysis of crypto assets by many traders and investors to spot potential buying and selling areas and identify an asset’s current trend.
There are two common Moving Averages: the Simple Moving Average (SMA) and the Exponential Moving Average (EMA). Most traders prefer using EMA because it filters the price actions and volatility that come with trading in the crypto market and gives traders a more realistic value than the SMA by placing more weight on recent price data.
Trading with EMA gives a trader more opportunities. It helps you to identify dynamic support and resistance, enabling you as a trader to enter and exit trades when the trend reverses against your trade.
As a trader, you do not need to start learning the formulas and how the Exponential Moving Average was achieved, all you need to do is make use of it on tradingview.com while analyzing your crypto assets.
How To Use EMA And Ride Massive Trends
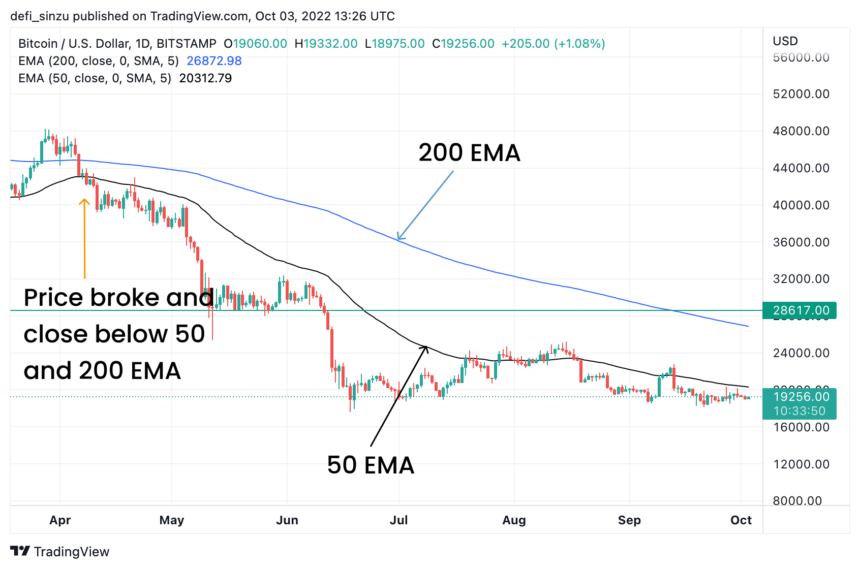
The commonly used Exponential Moving Averages are the 50 and 200-day EMA for long-term traders to spot trends and ride early trends based on the high timeframes. For short-term trading, traders use 8 and 20-day EMA to spot trends, entries, exits, and potential price reversals.
Example Of 50 And 200-Day EMA
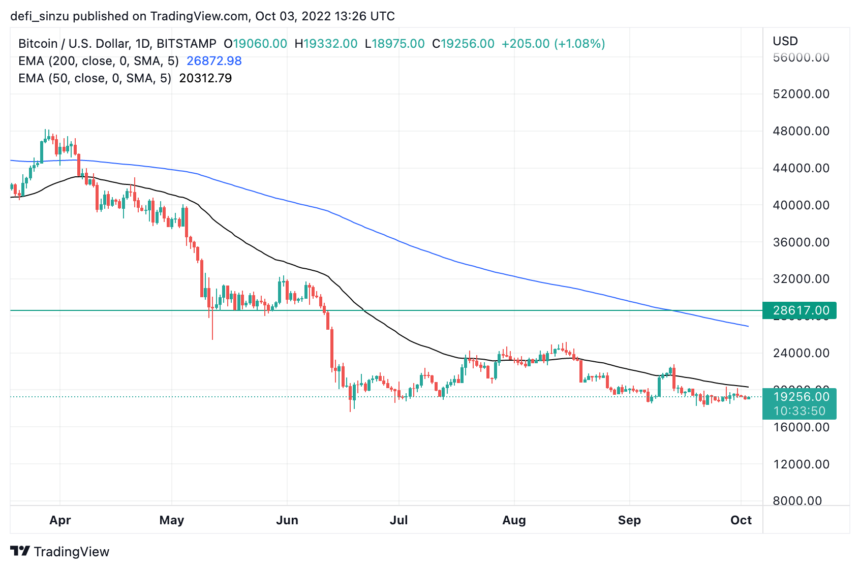
From the chart above, the price of Bitcoin/United State Dollars (BTCUSD) trades below the 50…
Click Here to Read the Full Original Article at NewsBTC…


