Ethereum’s native token Ether (ETH) has rebounded 40% against Bitcoin (BTC) after bottoming out locally at 0.049 on June 13. Now, the ETH/BTC pair is at two-month highs and can extend its rally in the coming weeks, according to a classic technical pattern.
ETH paints cup and handle pattern
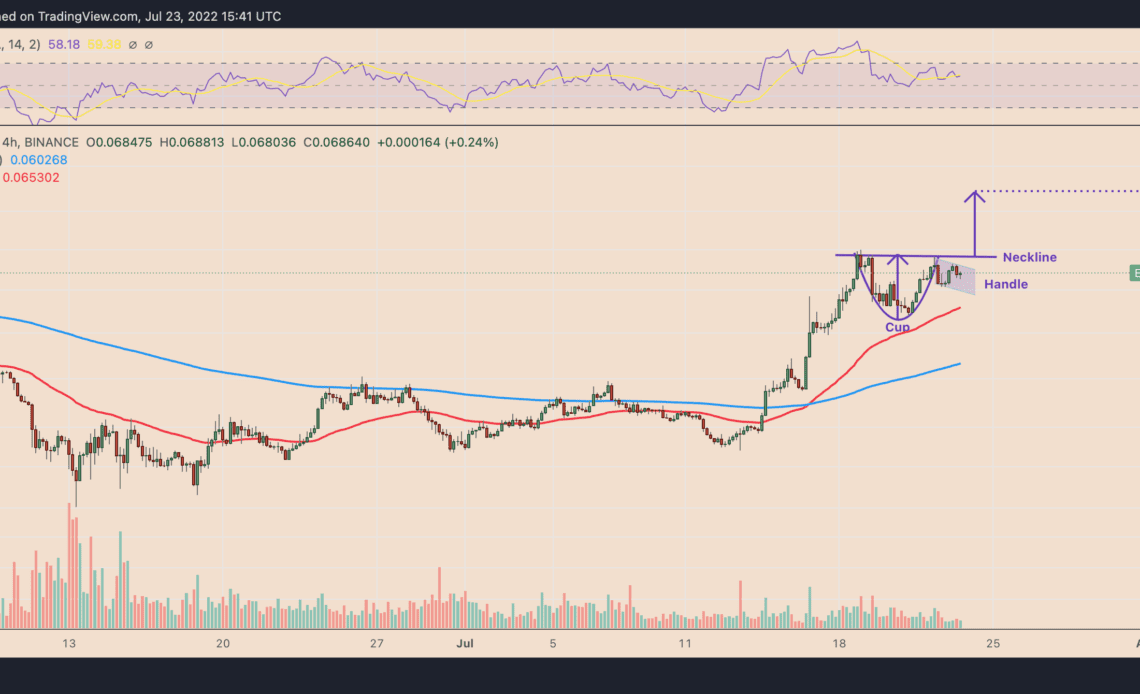
Specifically, ETH/BTC has been forming a “cup and handle” on its lower-timeframe charts since July 18.
A cup and handle setup typically appears when the price falls and then rebounds in what appears to be a U-shaped recovery, which looks like a “cup.” Meanwhile, the recovery leads to a pullback move, wherein the price trends lower inside a descending channel called the “handle.”
The pattern resolves after the price rallies to an approximately equal size to the prior decline. The ETH/BTC chart below illustrates a similar bullish technical setup.
Notably, the pair now trades lower inside the handle range but could pursue a recovery toward the neckline resistance near 0.071 BTC. Afterward, a decisive cup and handle breakout above the neckline level could lead ETH/BTC to 0.072, up 12.75% from today’s price.
The success rate of the cup and handle pattern in reaching its profit target is 61%, according to veteran investor Tom Bulkowski.
The Merge factor
The bullish setup for ETH/BTC also takes cues from Ethereum’s network transition from proof-of-work (PoW) to proof-of-stake (PoS) potentially via “the Merge” slated for mid September.
Related: Will Ethereum Merge hopium continue, or is it a bull trap?
Meanwhile, market analyst Michaël van de Poppe says that Ether could see more upside versus Bitcoin due to the Merge hype as momentum builds in the coming weeks.
Basically a few levels on $ETH.
Facing resistance at 0.0725 $BTC.
Facing support at either 0.0645 $BTC or 0.057 $BTC.
Overall, expecting more momentum going towards the merge in September. pic.twitter.com/QpmkyTwjyb
— Michaël van de Poppe (@CryptoMichNL) July 23, 2022
Van de Poppe…
Click Here to Read the Full Original Article at Cointelegraph.com News…


