The United States equities markets rallied sharply last week, ending a three-week losing streak. The S&P 500 rose 3.65% last week while the Nasdaq Composite soared 4.14%. Continuing its close correlation with the U.S. equities markets, Bitcoin (BTC) also made a strong comeback and is trying to end the week with gains of more than 7%.
The sharp rally in the stock markets and cryptocurrency markets are showing signs of a bottoming formation but it may be too early to predict the start of a new bull move. The equities markets may remain on the edge before the release of the U.S. inflation data on Sept. 13 and the Federal Reserve meeting on Sept. 20-21.
Along with taking cues from the equities markets, the cryptocurrency space has its own important events to look forward to. Both the Ethereum’s Merge and Cardano’s (ADA) Vasil hard fork scheduled in the next few days could heighten volatility in several cryptocurrencies.
Although choppy markets increase the risk, they may offer short-term trading opportunities to nimble traders. Let’s study the charts of five cryptocurrencies that look interesting in the near term.
BTC/USDT
Bitcoin soared above the 20-day exponential moving average ($20,662) on Sept. 9, which was the first indication that the selling pressure could be reducing. The bears are attempting to stall the recovery at the 50-day simple moving average ($21,946) but a positive sign is that the bulls have not given up much ground.
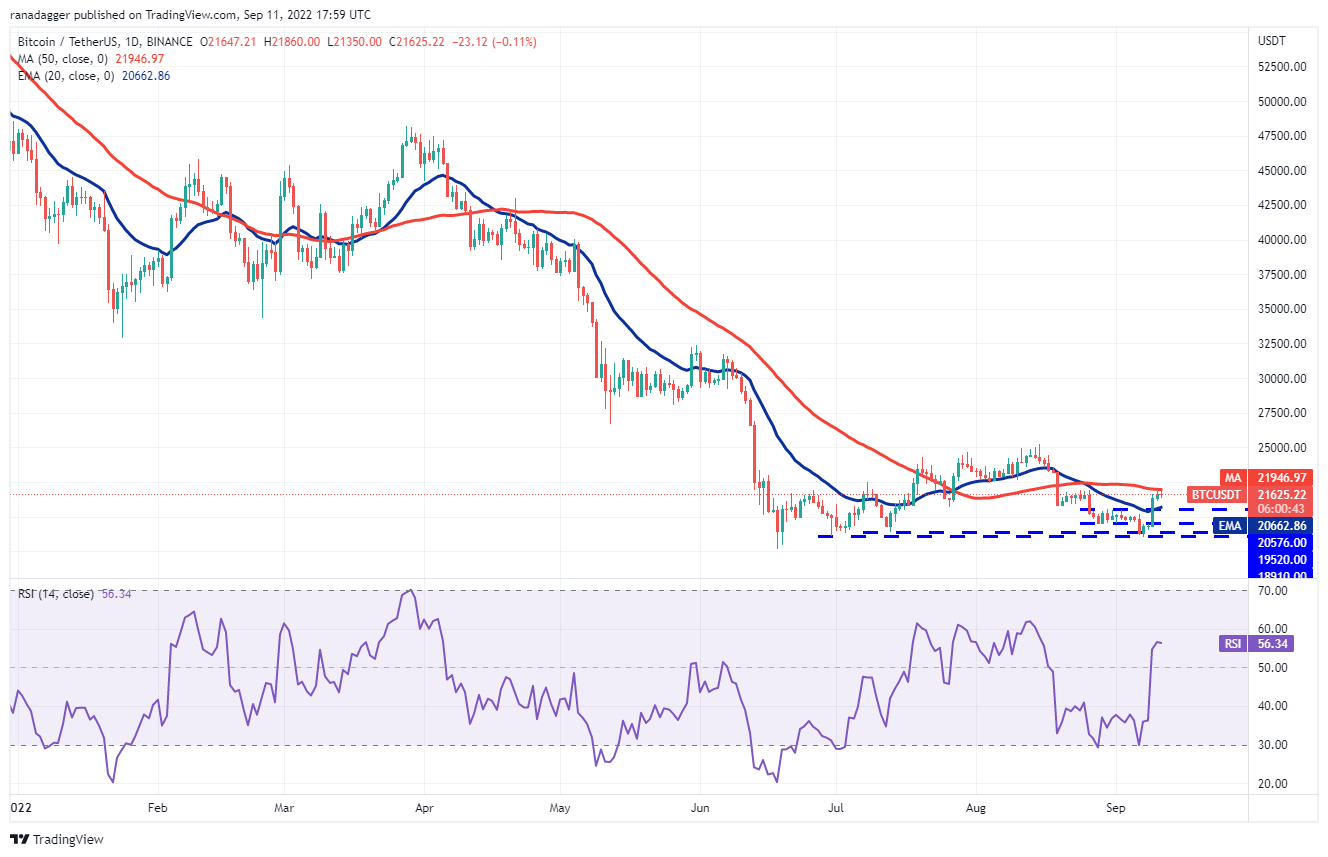
The 20-day EMA has started to slope up gradually and the relative strength index (RSI) is in the positive territory indicating that the path of least resistance is to the upside. If bulls propel the price above the 50-day SMA, the BTC/USDT pair could rally toward the stiff overhead resistance at $25,211. The bears are expected to defend this level with vigor.
Another possibility is that the price turns down from the 50-day SMA. If that happens, the pair may drop to the 20-day EMA. This is an important level to keep an eye on because a break and close below it could open the doors for a drop to $18,626. Alternatively, if the price rebounds off the 20-day EMA, it will increase the likelihood of a break above the 50-day SMA.
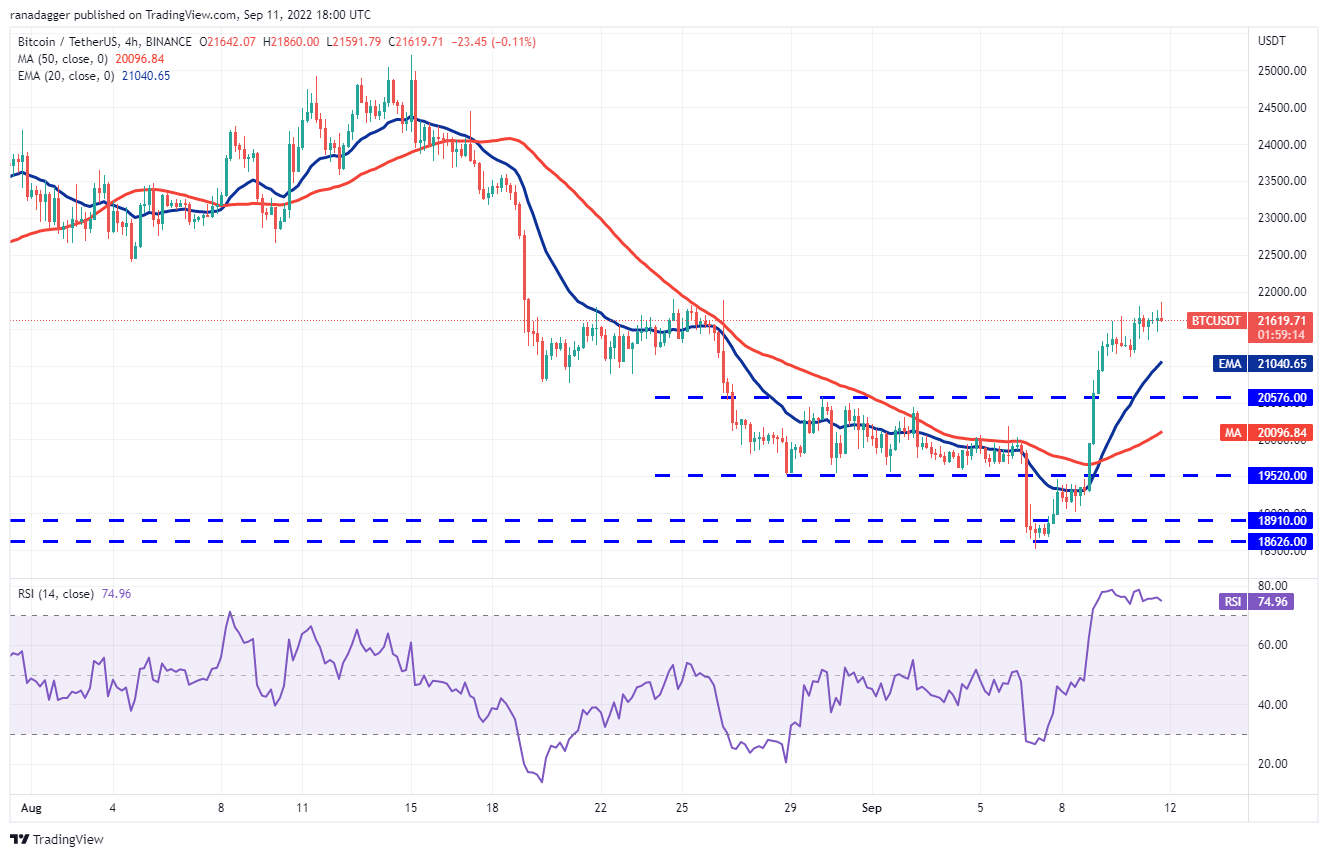
The pair picked up momentum after rising above the breakdown level of $19,520. The sharp rally pushed the RSI into the overbought territory, suggesting a minor consolidation or…
Click Here to Read the Full Original Article at Cointelegraph.com News…


