Bitcoin is stuck at its current levels, but the market might begin moving again before 2023 makes its entry. The key factors shaping global markets are changing, and cryptocurrencies are bound to follow the general trend into the new year.
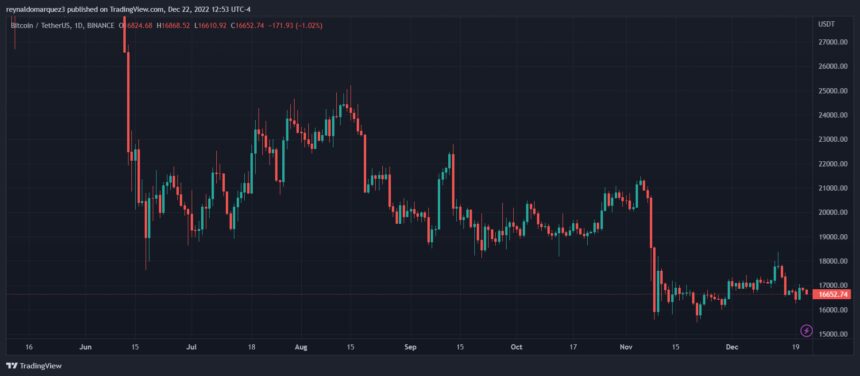
As of this writing, Bitcoin trades at $16,800 with sideways movement in the last 24 hours. On higher timeframes, the cryptocurrency records a 6% loss. Other assets in the crypto top 10 by market capitalization are moving in tandem with BTC and record losses in this period.
Bitcoin Investors Should Brace For Incoming Volatility
Bitcoin and the crypto market are poised for volatile days during the holiday season. From now until the end of the year, markets will see less trading volume, making assets susceptible to sudden price movements.
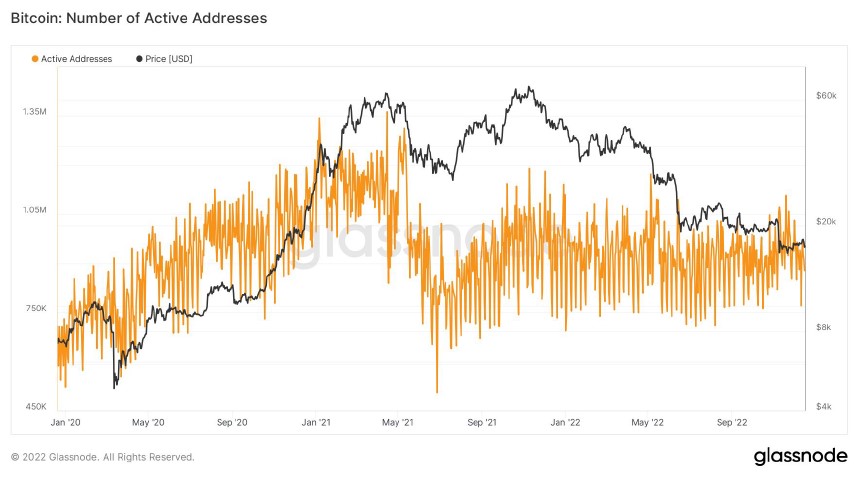
According to a report from crypto exchange Bitfinex, the number of active Bitcoin addresses is declining. This number has been trending to the downside across 2022.
The chart below shows that the number of daily active addresses averaged 921,445 during this period, representing a decline of 1.1 million compared to 2021. This reduction in activity will contribute to the spike in volatility.
The last week of the year has seen a steeper decline in activity, and trading volume, since 2013. In addition, the downside action
Data since 2013 suggests that there is always a decline of 3-4 percent in the number of daily active addresses in the last week of the year compared to the previous month. Aside from the decline in trading volumes, the fall in DAA could also correspond to reduced mining operations as miners’ activity corresponds to BTC’s most significant on-chain movements.
Finding Direction For The BTC Price
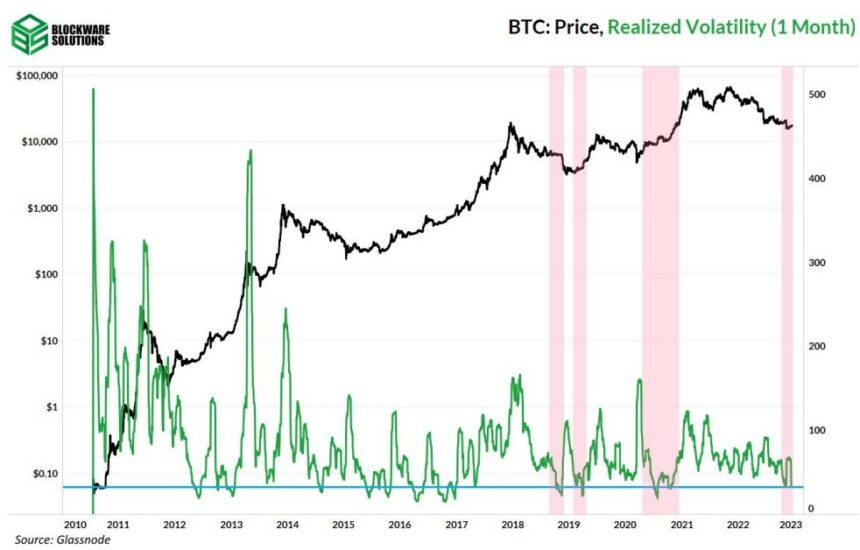
According to the report, one metric is vital to forecast BTC’s direction amid higher volatility. This metric is the Monthly Realised Volatility, which measures what has happened in the market over the past 30 days.
This metric is at its lowest “since Q3 of 2022, just before the last bull run.” As seen in the chart below, each time Monthly Realised Volatility reached similar levels, the Bitcoin price trends to the upside over the coming months.
The current trend in the market is to the downside, but many experts have begun…
Click Here to Read the Full Original Article at NewsBTC…


