Data shows the Bitcoin exchange inflows and outflows have both shrunk recently as market activity has remained low.
Bitcoin Exchange Inflows & Outflows Continue To Decline
As per the latest weekly report from Glassnode, the BTC inflow volumes are now only around $350-$400 million per day. The “exchange inflow” is an indicator that measures the total amount of Bitcoin currently being deposited to centralized exchanges by holders. Its counterpart metric is the “exchange outflow,” and it naturally tracks the volume leaving exchange wallets.
Generally, during periods of high activity in the market, both these indicators rise to high values as a large number of investors make their respective moves. However, the price may react in particular directions depending on which of these metrics is higher at the moment.
Since one of the main reasons why investors use exchanges is for selling purposes, inflows outweighing outflows could be bearish for Bitcoin. On the other hand, outflows being more dominant can suggest there may instead be buying pressure in the market as investors are withdrawing their coins for accumulation.
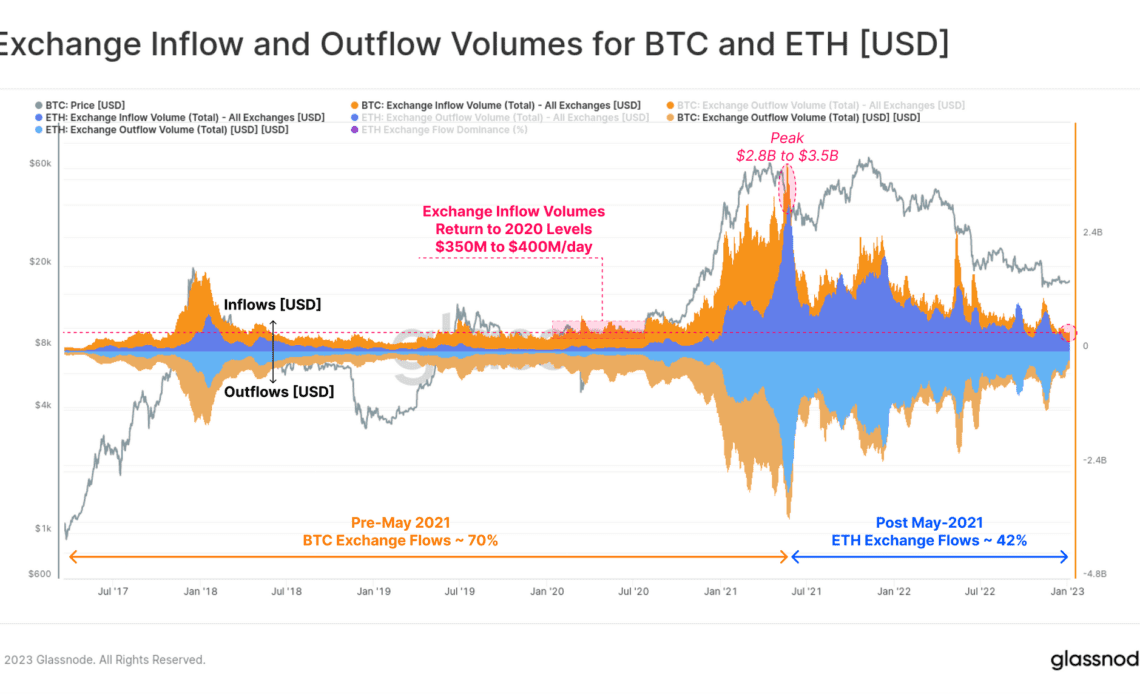
Now, here is a chart that shows the trend in the Bitcoin exchange inflows and outflows over the last few years:
looks like both these metrics have declined in recent weeks | Source: Glassnode's The Week Onchain - Week 2, 2023
As shown in the above graph, the Bitcoin exchange inflows and outflows were both at high levels during the past couple of years, with their volumes remaining in the range of multi-billion dollars throughout. At the peak of inflows back in May 2021, between $2.8 billion to $3.5 billion per day was entering exchange wallets.
Recently, however, both the inflows and the outflows have significantly declined. Currently, the inflow volumes are between $350 million to $400 million per day, which are lows not seen since 2020. The outflows haven’t quite shrunk to these levels yet, possibly because of the fact that the collapse of FTX lead to renewed interest in self-custody among investors, which made them withdraw large amounts from centralized platforms.
In the chart, data for the Ethereum exchange flows are also displayed. It seems like before May 2021, the Bitcoin exchange flow dominance was about 70%, which means the combined volumes of Ethereum inflows and outflows made up for 30% of the total between ETH and BTC during the period.
But since May 2021, the share of the Ethereum flows has significantly increased as…
Click Here to Read the Full Original Article at NewsBTC…


