After the impressive rally in January, Bitcoin (BTC) seems to be taking a breather in February. This is a positive sign because vertical rallies are rarely sustainable. A minor dip could shake out the nervous longs and provide an opportunity for long-term investors to add to their positions.
Has Bitcoin price bottomed?
The opinion remains divided, however, on whether Bitcoin has bottomed out or not. Some analysts expect the rally to reverse direction and nosedive below the November low while others believe the markets will continue to move up and frustrate the traders who are waiting to buy at lower levels.
In an interview with Cointelegraph, Morgan Creek Capital Management founder and CEO Mark Yusko said “the crypto summer” could begin as early as the second quarter of this year.
He expects risk assets to turn bullish if the United States Federal Reserve signals that it will slow down or pause interest rate hikes. Another potential bullish catalyst for Bitcoin is the block reward halving in 2024.
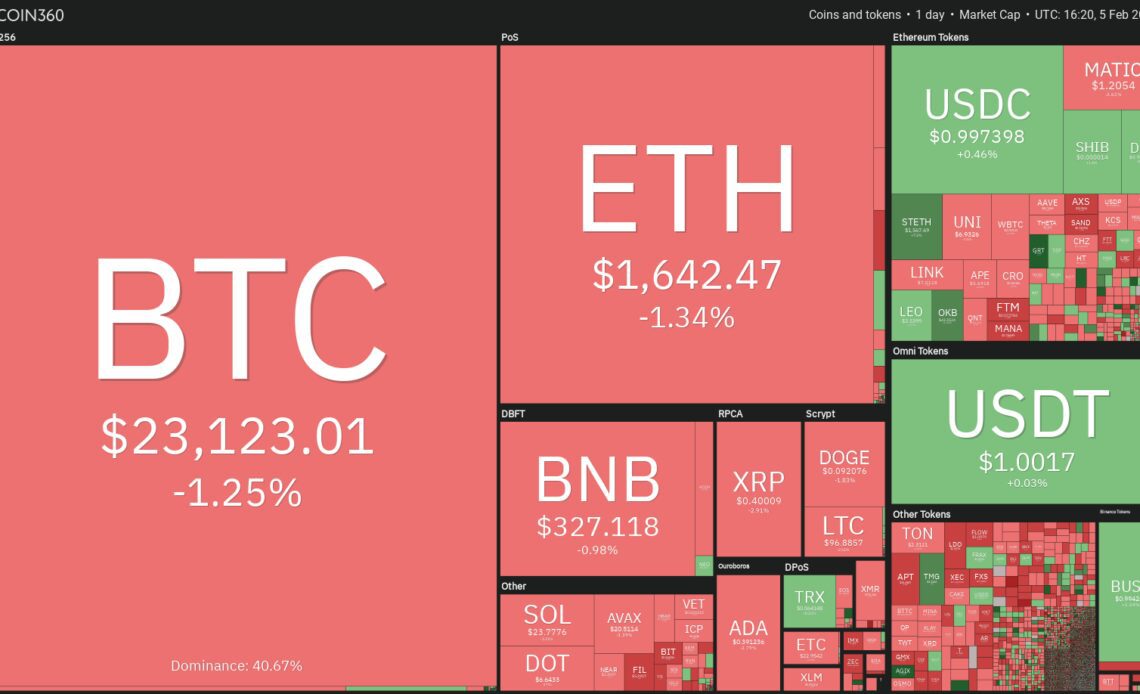
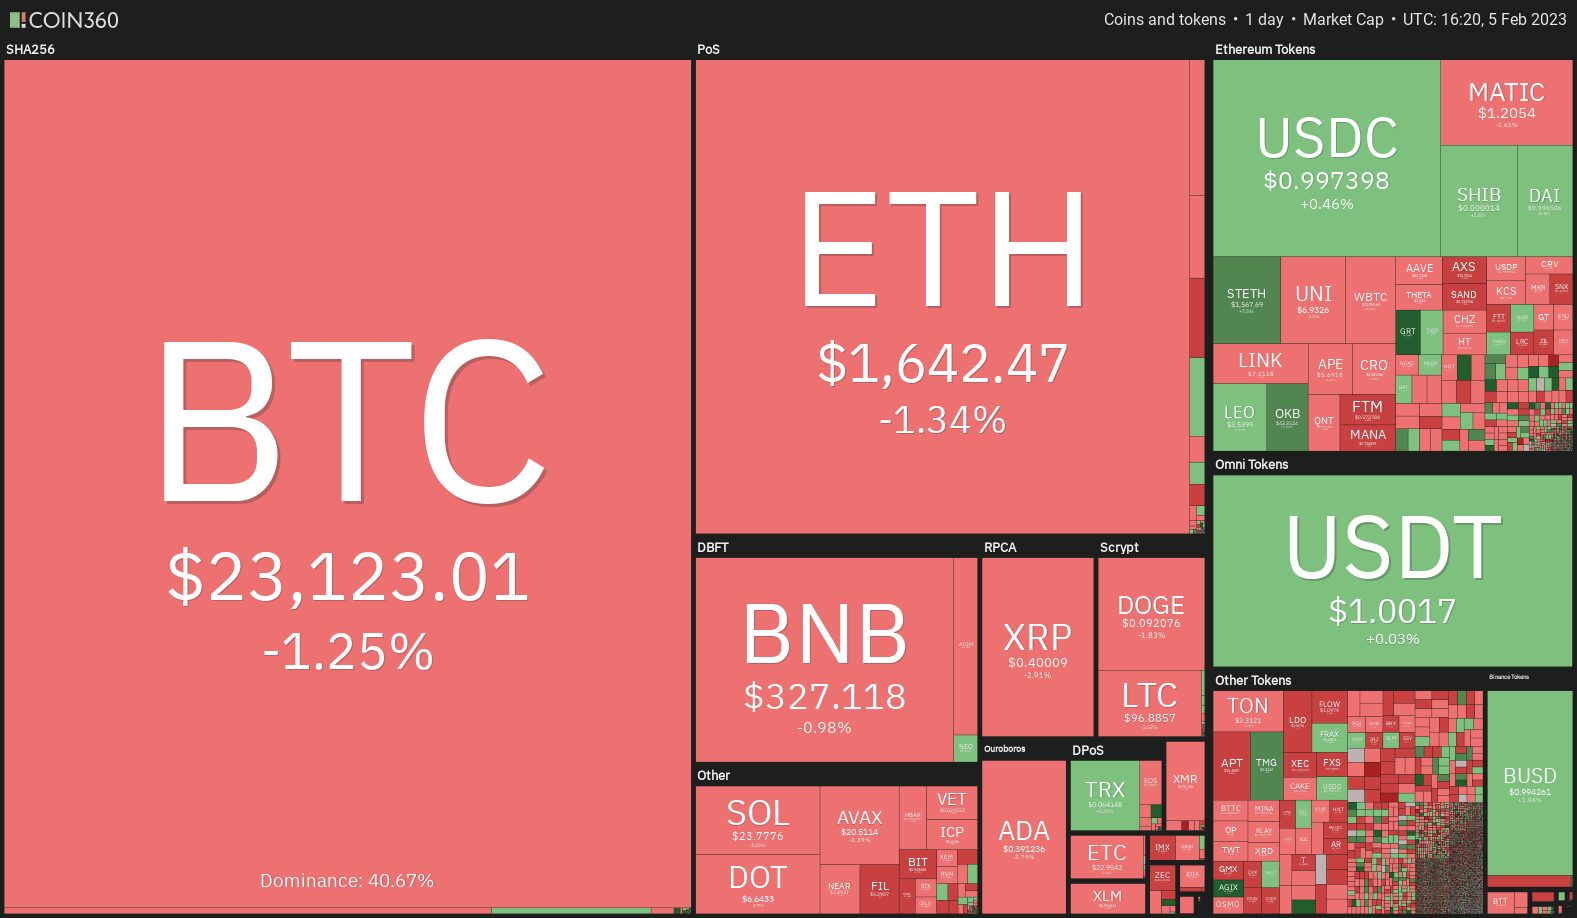
Could the altcoins continue their up-move while Bitcoin consolidates in the near term? Let’s study the charts of Bitcoin and select altcoins that may outperform in the next few days.
BTC/USDT
Bitcoin has been gradually correcting since hitting $24,255 on Feb. 2. This indicates profit booking by short-term traders. The price is nearing the strong support zone between $22,800 and $22,292. The 20-day exponential moving average ($22,436) is also located in this zone, hence the buyers are expected to defend the zone with all their might.
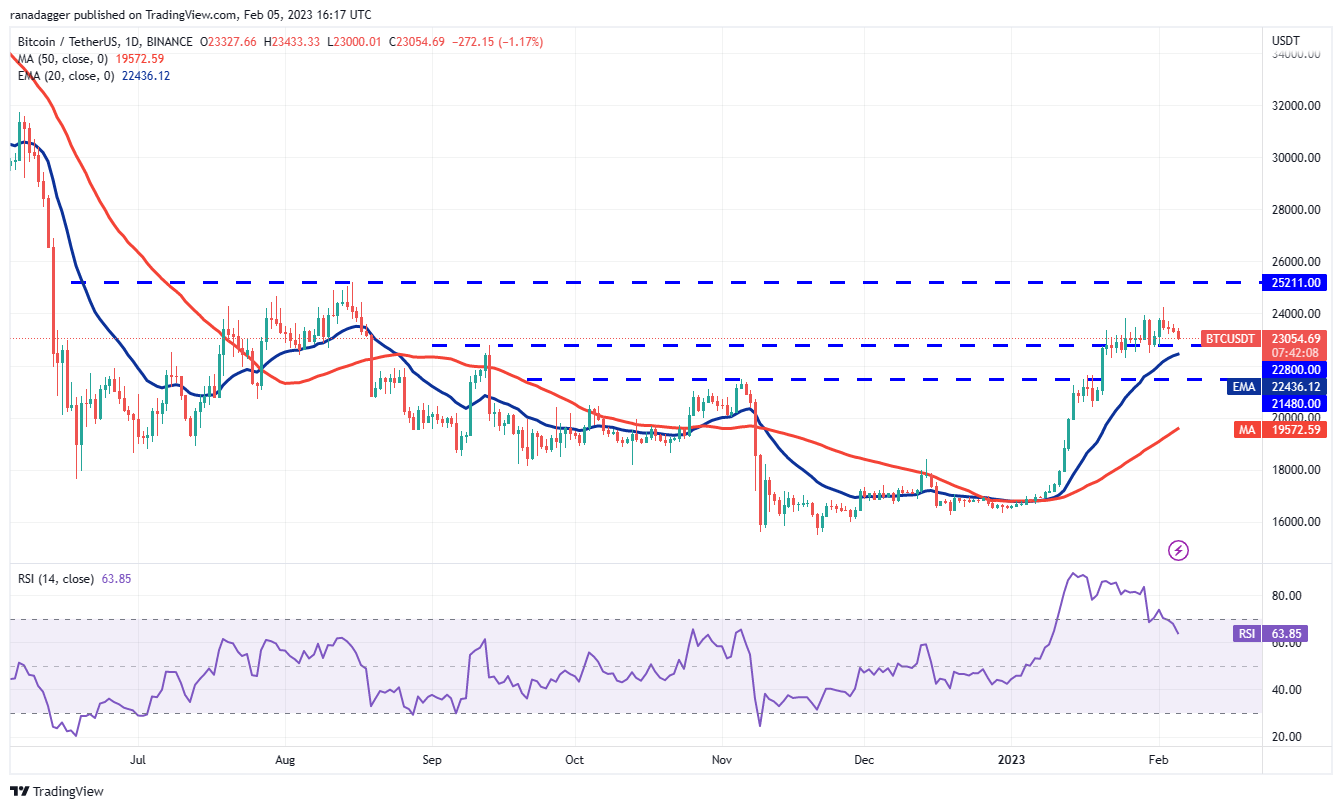
The upsloping 20-day EMA and the relative strength index (RSI) in the positive territory indicate that bulls have the edge. If the price turns up from the support zone, the bulls will again attempt to catapult the BTC/USDT pair to $25,000. This level should act as a formidable resistance.
On the downside, a break below the support zone could trigger several stop losses and that may start a deeper pullback. The pair could first drop to $21,480 and if this support also fails to hold up, the next stop may be the 50-day simple moving average ($19,572).
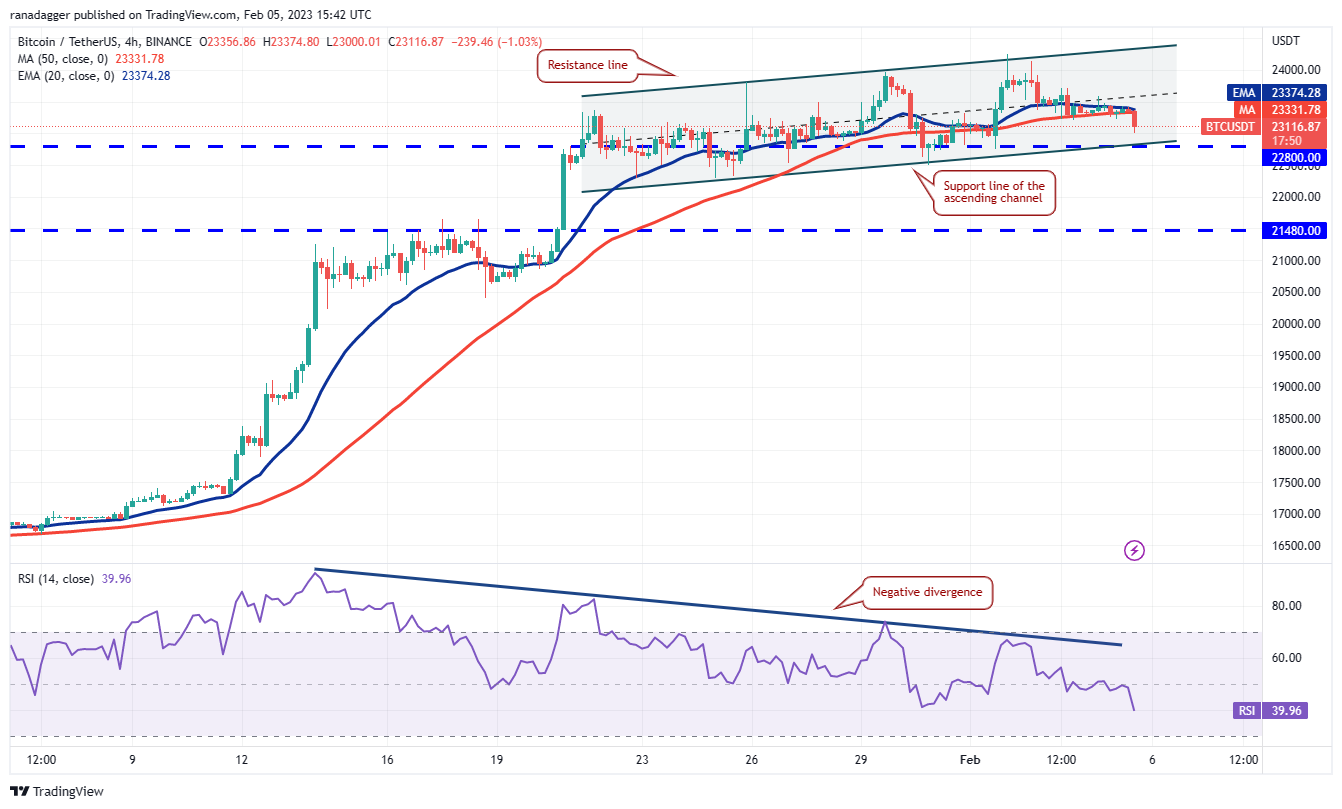
The 4-hour chart shows that the price is trading inside an ascending channel but the RSI has been forming a negative divergence. This suggests that the bullish momentum may be weakening. A break and close below the channel could tilt the short-term advantage in…
Click Here to Read the Full Original Article at Cointelegraph.com News…


