The bull market is gone and the reality of a long crypto winter is surely giving traders a bad case of the shivers. Bitcoin’s (BTC) price has fallen to lows not even the bears expected, and some investors are likely scratching their heads and wondering how BTC will come back from this epic decline.
Prices are dropping daily, and the current question on everyone’s mind is: “when will the market bottom and how long will the bear market last?”
While it’s impossible to predict when the bear market will end, studying previous downtrends provides some insight into when the phase is coming to a close.
Here’s a look at five indicators that traders use to help know when a crypto winter is coming to a close.
The crypto industry begins to recover
One of the classic signs that a crypto winter has set in is widespread layoffs across the crypto ecosystem as companies look to trim expenses to survive the lean times ahead.
News headlines throughout 2018 and 2019 were filled with layoff announcements from major industry players, including technology companies like ConsenSys and Bitmain, as well as crypto exchanges like Huobi and Coinfloor.
The recent rash of layoff announcements such as the 18% reduction in staff for Coinbase and a 10% cut at Gemini are concerning, and given that the current bear market just started, layoffs are likely to crescendo. This means that it’s probably too early to refer to this metric as proof that the bear market is in decline.
A good sign that a crypto spring is approaching is when companies begin to hire again and new projects launch with notable funding announcements. These are indications that funds are beginning to flow back into the ecosystem and the worst of the bear market is in the past.
Watch to see if Bitcoin’s 200 week SMA becomes resistance or support
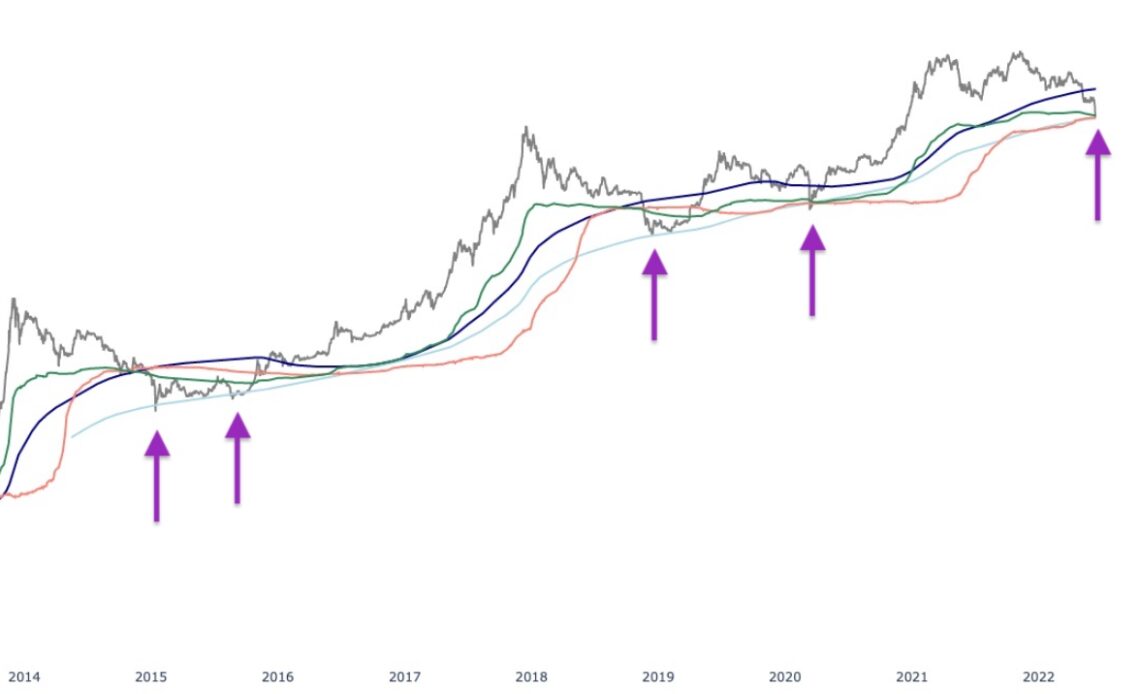
A technical development that has signaled the end of a bearish period multiple times in Bitcoin’s history is when the price falls below the 200-week simple moving average (SMA) and then climbs back above it.
As shown in the areas highlighted by purple arrows on the chart above, previous instances where the price of BTC dipped below the 200-week SMA, the light blue line, and then climbed back above the metric preceded uptrends in the market.
A solid BTC price recovery back above the realized price, which is the aggregate purchase price of all Bitcoin and is represented by the green line in the chart above, can also be used as an…
Click Here to Read the Full Original Article at Cointelegraph.com News…


