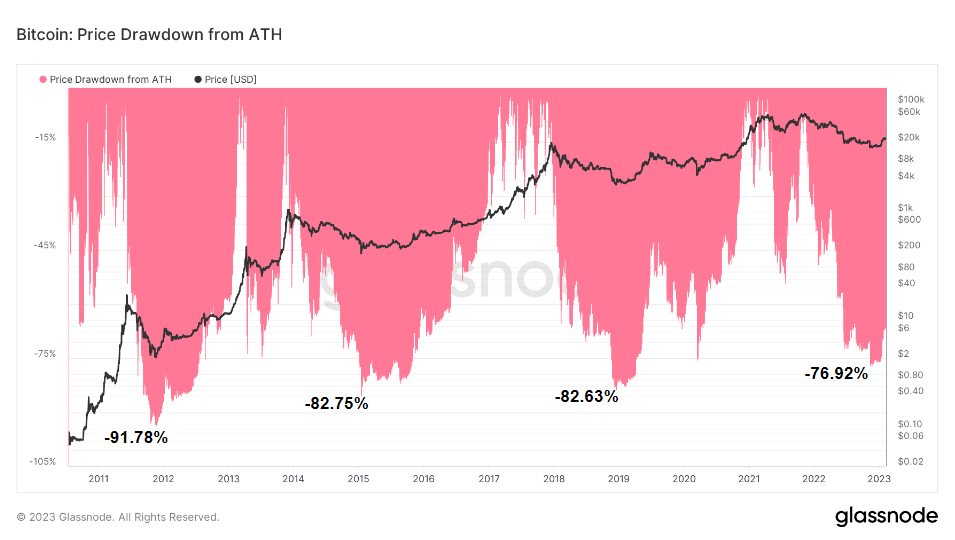
Analyzing Bitcoin’s market cap shows that the 2022 bear market brought the fourth worse drawdown from the all-time high in its history. Bitcoin’s drop to $15,500 represents a 76.92% drawdown from its ATH.
Market capitalization is one of the most widely used metrics when estimating the size and value of an asset. Defined as the combined value of all units of an asset, market capitalization is calculated by multiplying the price by the circulating supply.
When it comes to Bitcoin, market capitalization and its fluctuation is often used to determine the strength and adoption of the network. It’s also especially useful when comparing Bitcoin to other assets and markets.
The most significant price drawdown from ATH happened at the end of 2011 when an aggressive bear market wiped out 91.78% of Bitcoin’s market cap. Crypto winters in 2015 and 2018/2019 saw drawdowns of 82.75% and 82.63%, respectively.
This is in line with CryptoSlate’s previous analysis, which found that each market cycle posted higher lows.
However, market capitalization fails to represent the actual state of the network. Due to a large number of lost and inactive coins, market capitalization is often higher than the realized value of the network.
This is where realized cap comes in, as it shows the value of the Bitcoin network based on active coins.
Unlike market cap, which values coins based on their current value, realized cap values each UTXO based on the price at which it last moved. This approach is a much better proxy for the value stored in Bitcoin and can be used as an estimate of the aggregate cost basis of the network.
Realized cap drastically reduces dormant and lost coins’ impact on the network. These coins are seen as having low economic value, as they were last moved at a price so much lower than its realized price that they have little impact on it. However, if these coins were moved after being dormant for years, their impact on the realized price would be correspondingly significant.
The magnitude of change in realized cap shows the difference in price between the price at which a coin was last spent and the price at which it previously moved.
Looking at Bitcoin’s price through the realized cap shows that the 2022 drawdown was the second worse in its history. In November 2022, Bitcoin saw its realized cap drop by 18.8% from the all-time high recorded in November 2021.
Graph showing…
Click Here to Read the Full Original Article at Bitcoin (BTC) News | CryptoSlate…


